Fundus-specific preprocessing makes lesions easier to see, and attention rollout draws a heatmap of the retinal regions behind each grade. The student received a FastAPI web app, the Python code, an IEEE-format paper and the M.Tech report.
What is this project, at a glance?
| Level | M.Tech |
|---|---|
| Domain | Medical imaging, explainable AI (XAI) |
| Problem type | Five-class image classification: diabetic retinopathy severity (No DR, Mild, Moderate and Severe NPDR, Proliferative DR) from one fundus photo |
| Core methods | Ensemble of two pretrained ViT-B/16 checkpoints with label remapping, circular crop and Ben Graham preprocessing, flip test-time augmentation, attention rollout |
| Stack | Python, PyTorch, Hugging Face Transformers, FastAPI, plain HTML/CSS/JavaScript |
| Deliverables | IEEE-format paper, M.Tech report, web app, Python codebase, presentation outline |
What problem does this project solve?
Diabetic retinopathy, damage to the retina’s blood vessels caused by diabetes, is a leading preventable cause of blindness. Catching it early means grading fundus photos regularly, and there are far fewer eye specialists than screenings needed.
Deep learning can grade these photos, but the student faced three blocks:
- Single public models were unreliable. Two openly shared ViT checkpoints had opposite biases: one over-called mild disease, the other missed advanced disease.
- Grad-CAM does not fit transformers well. It assumes a CNN’s spatial feature maps, which a ViT does not have.
- Retraining was out of reach. Large fundus datasets need access approval and a GPU.
So the question became: can diabetic retinopathy detection using Vision Transformers work with an ensemble of existing models plus better preprocessing, and give a more useful and explainable grader on an ordinary laptop?
How does the diabetic retinopathy detection pipeline work?
Every image goes through five steps. No network is trained; the gains come from how existing models are combined and what they are shown.
Crop to the retina
The black border is cut away, so more of the model’s 224 × 224 input is actual retina.
Make lesions stand out
A Ben Graham transform subtracts a blurred copy of the image, evening out the lighting so small lesions such as microaneurysms stand out.
Run both models on two versions
Each ViT-B/16 model scores the raw and the enhanced image, each together with its mirror image (test-time augmentation).
Put both models on one scale
The two checkpoints order their labels differently, so a mapping layer moves every output onto the same five grades before averaging. Without it, the ensemble would silently mix up classes.
Explain the answer
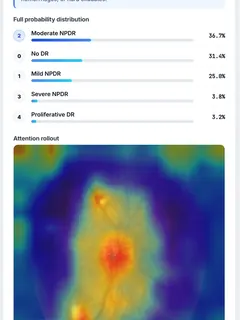
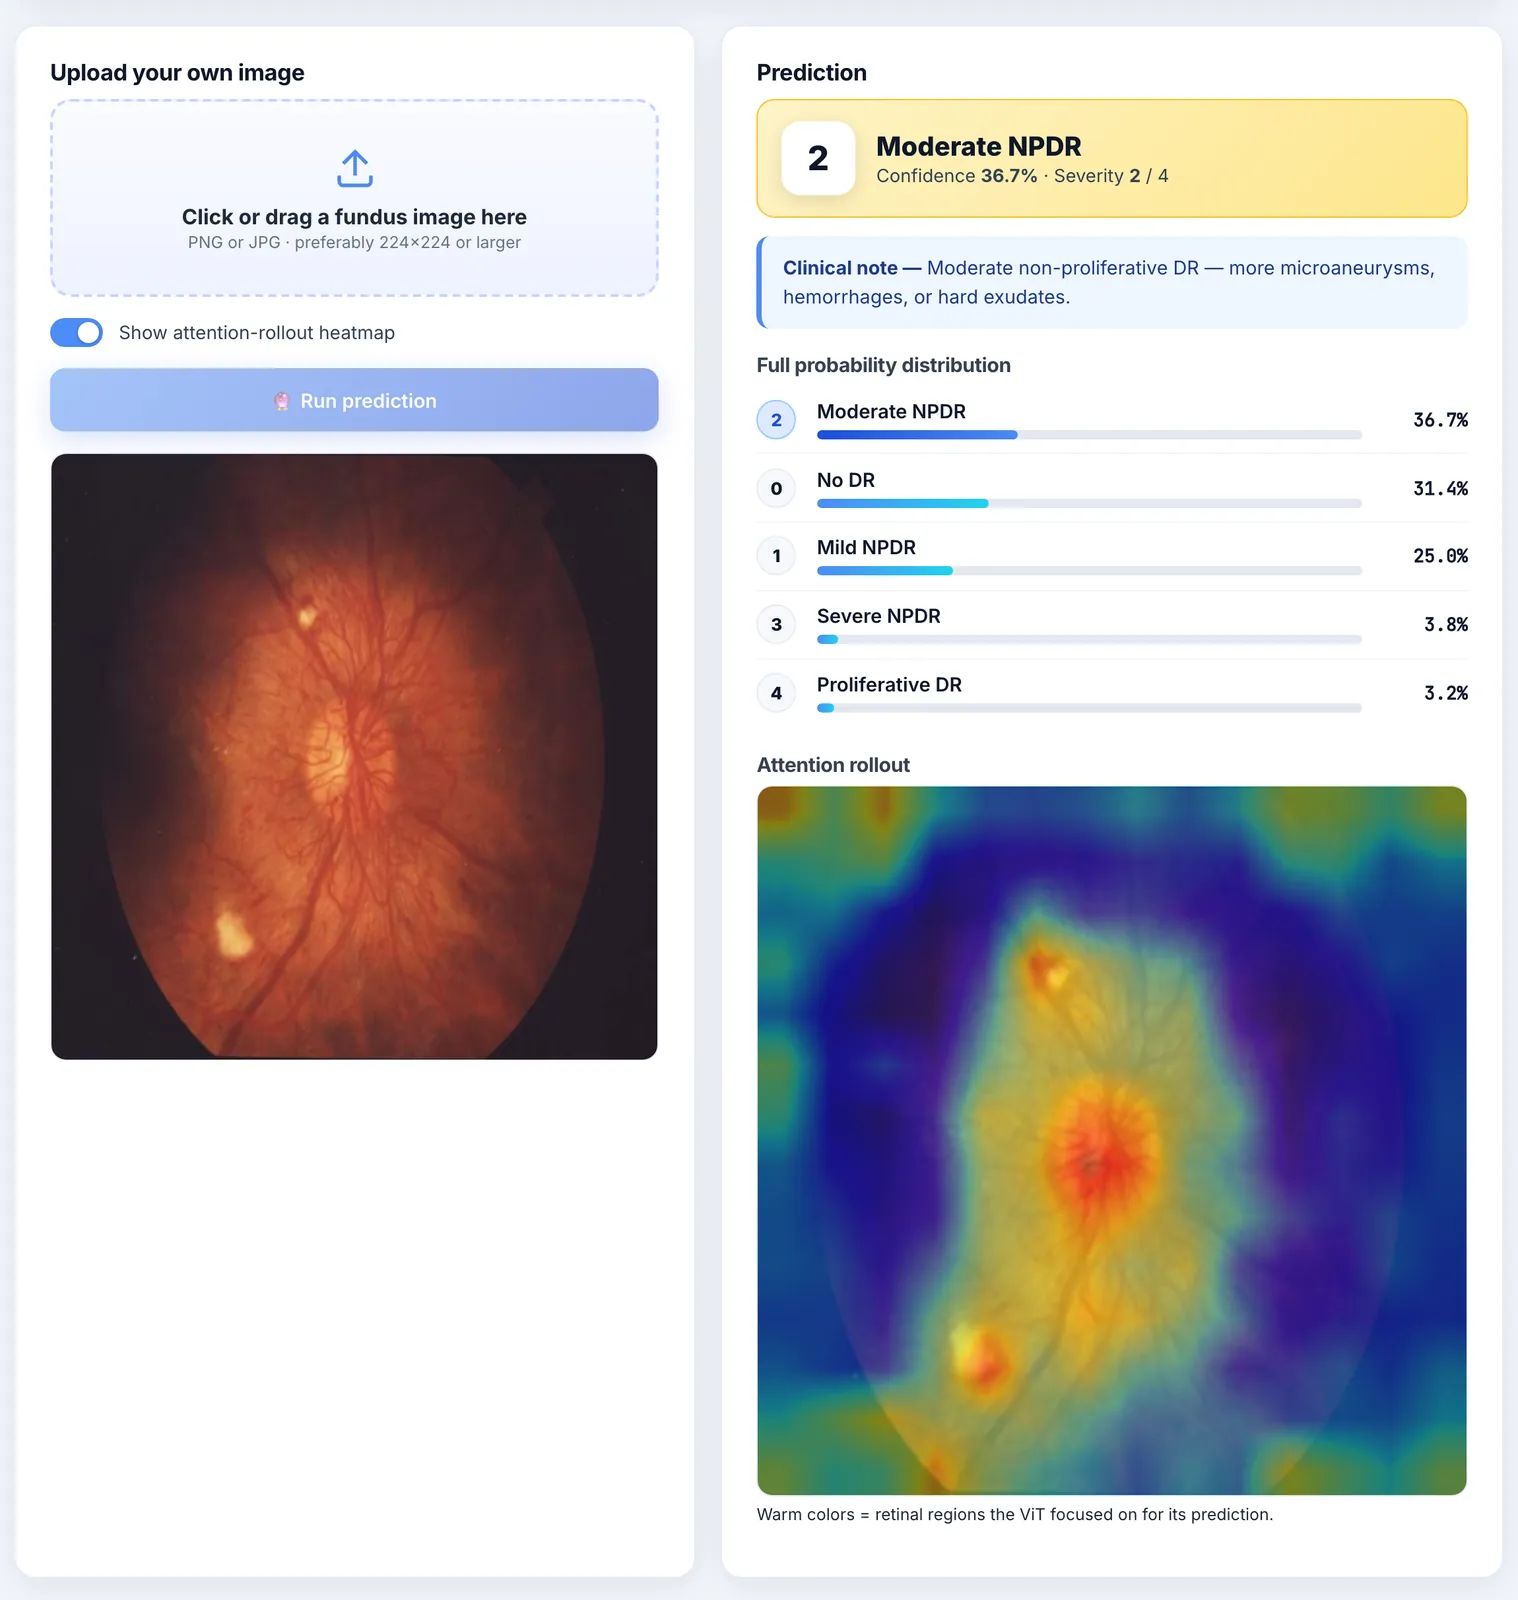
Attention rollout traces attention through all 12 transformer layers and overlays the image patches that drove the prediction as a heatmap.
What did we build?
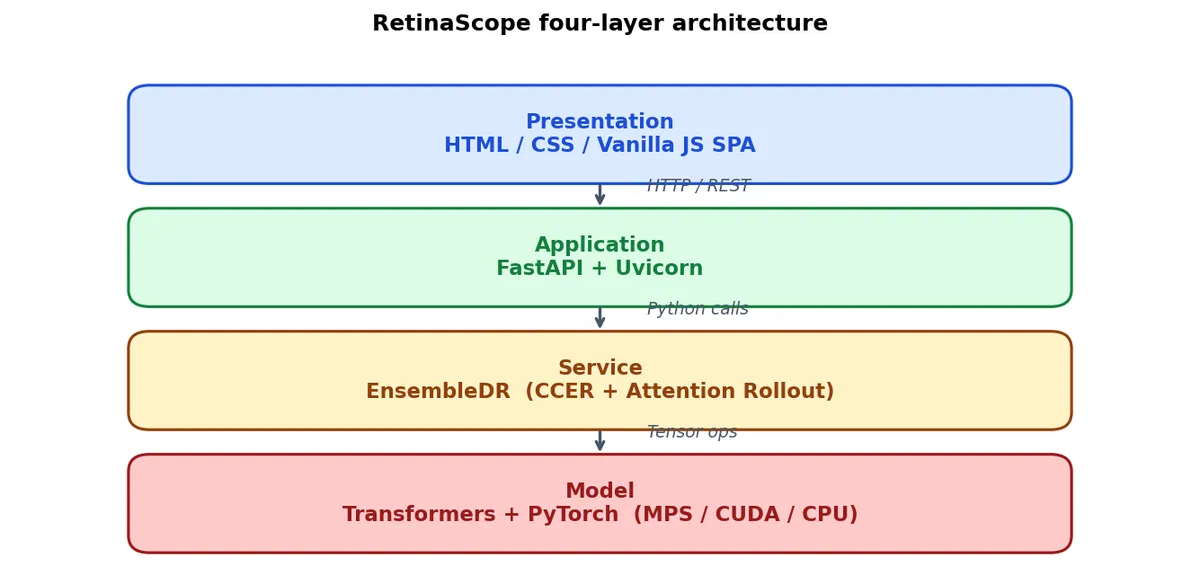
A five-tab single-page web app (Predict, Model, Diseases, Results, About) on a FastAPI backend. Drop in a fundus photo or pick a bundled, openly licensed sample, and the app returns the grade, a short clinical note, the probability of every grade and the attention heatmap.
The front end uses no JavaScript framework, so it is easy to explain. An optional ResNet50 training script for the RFMiD dataset is kept for later work.
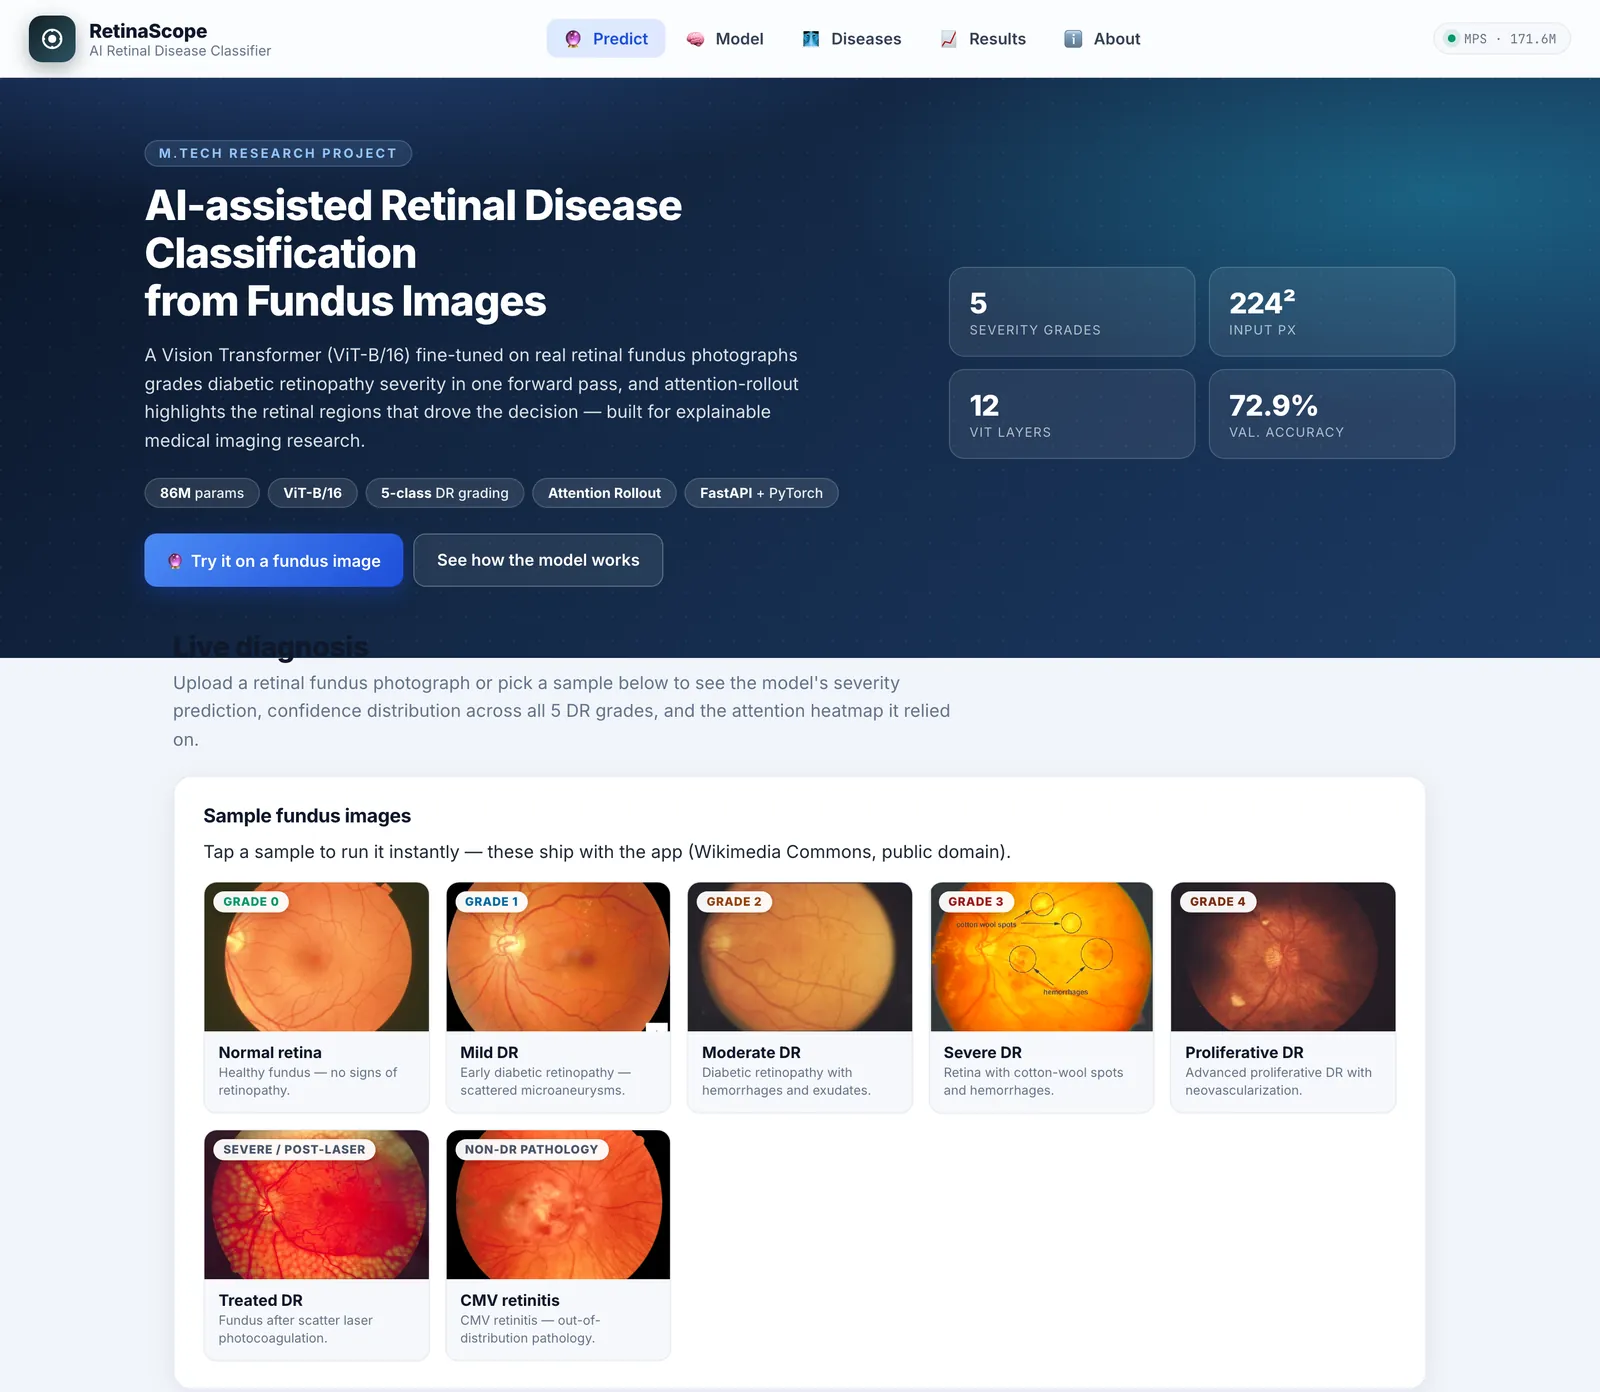
Shown with student, guide and institute details removed.
What did the results show?
Because nothing was retrained, the evaluation was small and qualitative: openly licensed fundus photos covering every grade, a treated retina and one out-of-distribution case. It is a proof of concept, not a clinical benchmark.
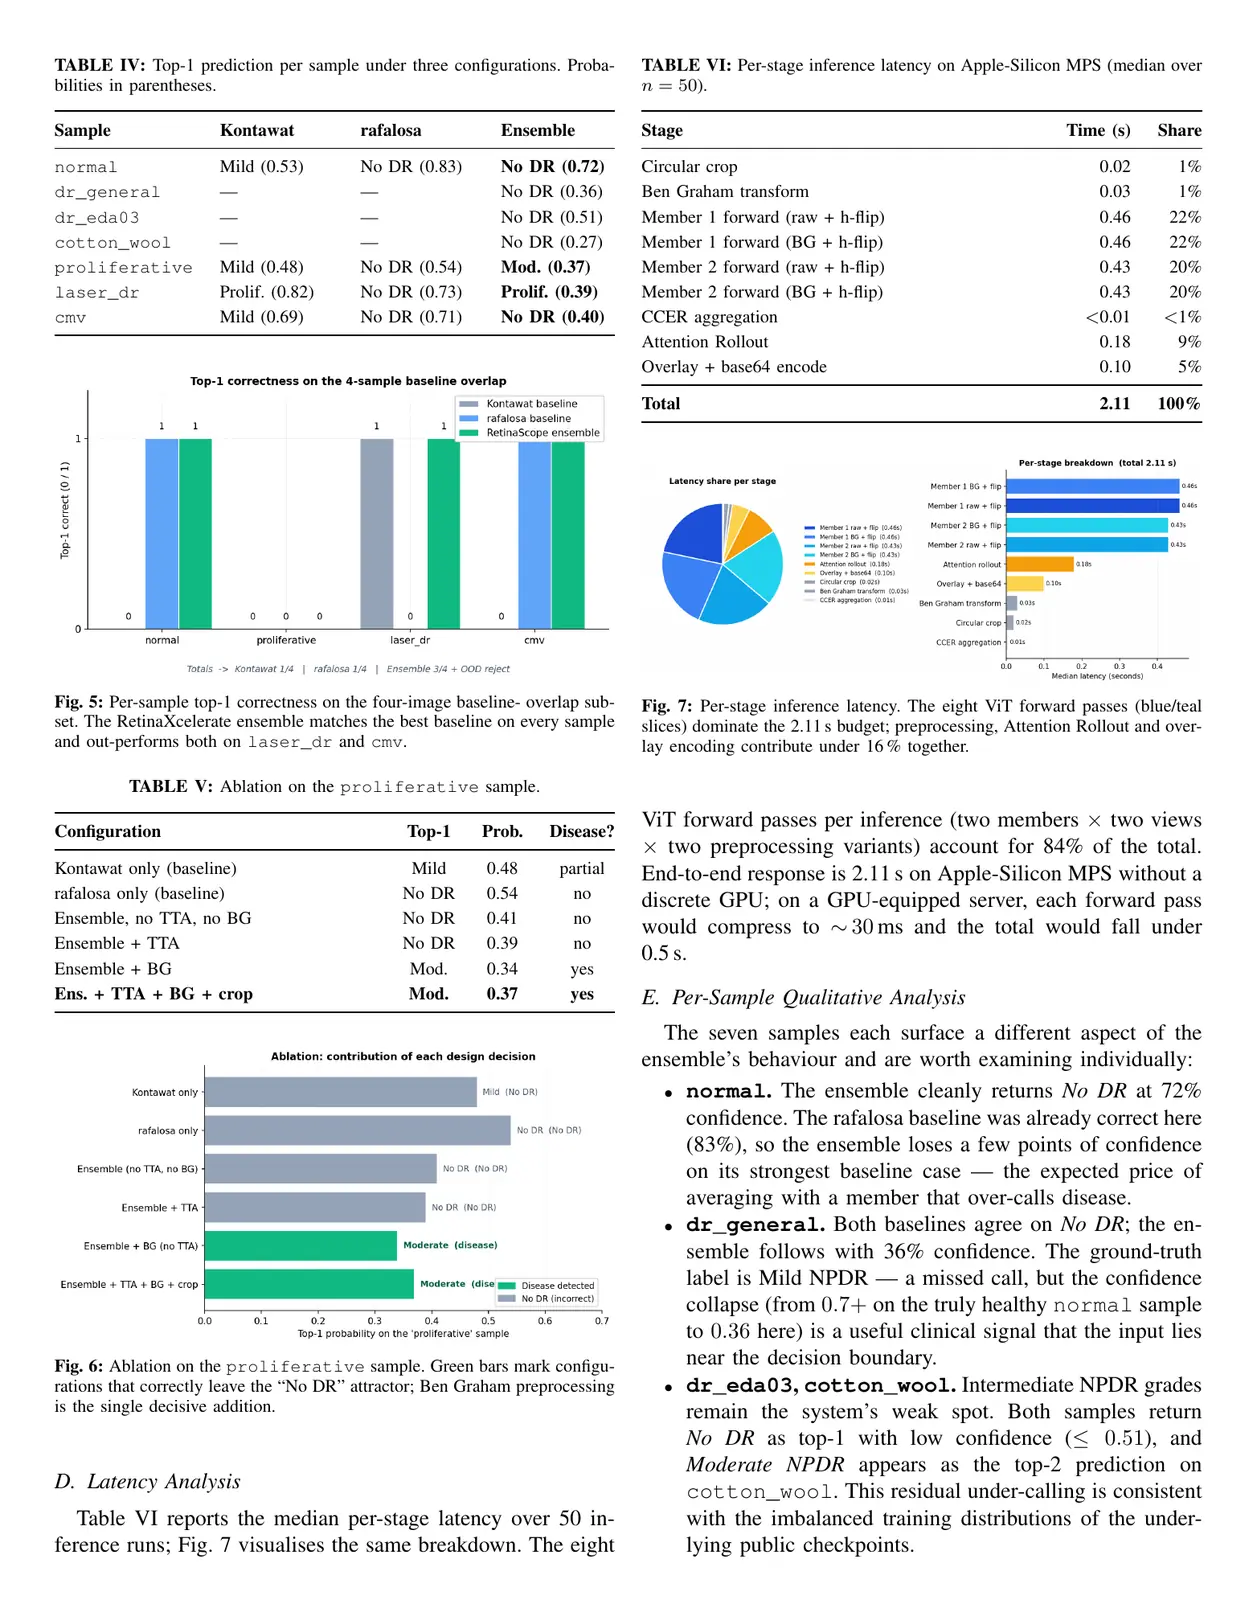
- Ensemble vs single models. The ensemble got more grades right than either model alone and did not call the out-of-distribution image diabetic retinopathy.
- Ablation. Ben Graham preprocessing was the one change that moved an advanced-disease sample from “No DR” to a disease grade.
- Weak spot. Mild and moderate grades were still under-called, likely because of imbalanced data behind the public checkpoints.
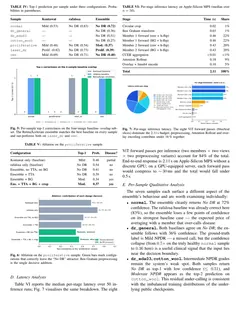
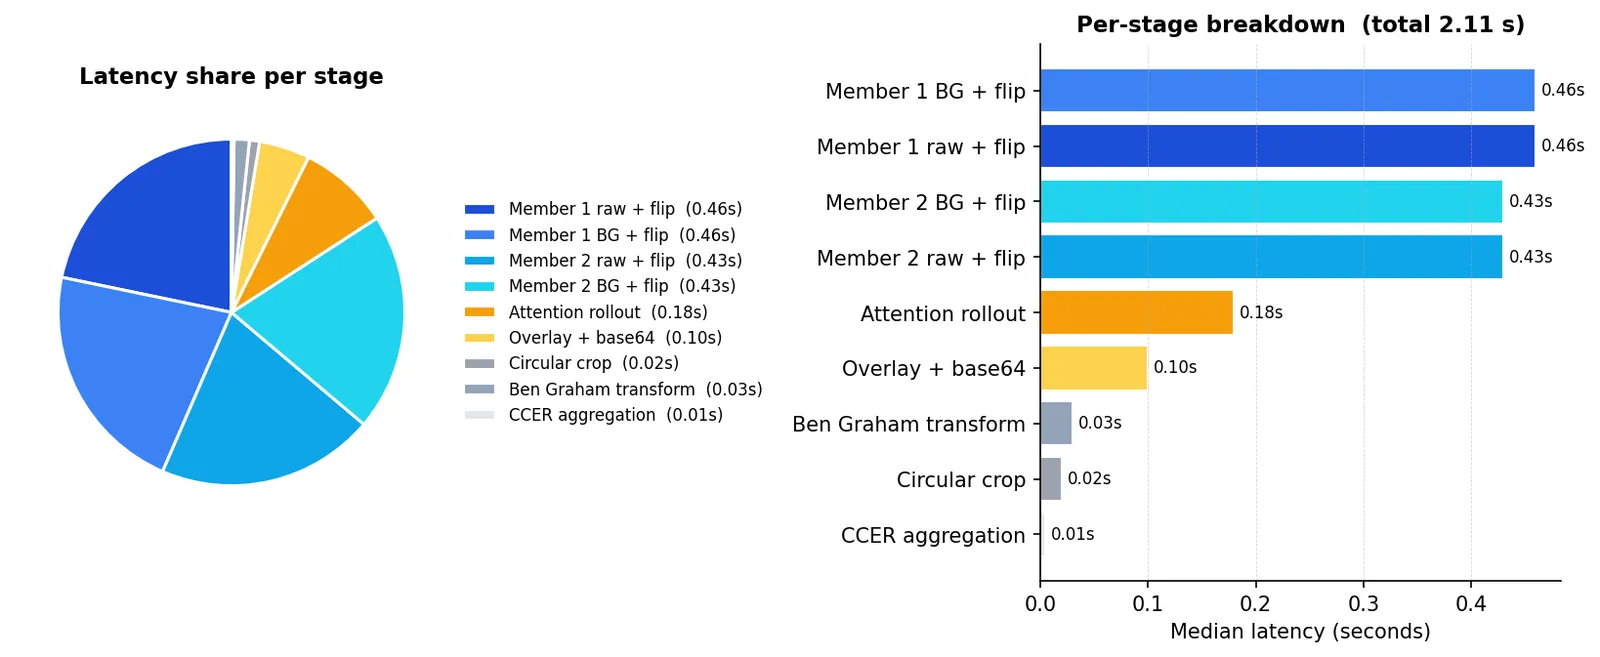
- Speed. A full prediction with heatmap took 2.11 s on a laptop without a discrete GPU.
Shown with student, guide and institute details removed.
What did the student receive?
Everything needed to run, submit and defend the project, with the paper written to the IEEE paper format for conferences.
| Deliverable | What it contains |
|---|---|
| IEEE-format paper | PDF and LaTeX source: method, results, ablation, latency and limitations |
| M.Tech report | Project report (thesis) as PDF and LaTeX source |
| Web app | FastAPI backend and a five-tab front end with sample images |
| Python codebase | Ensemble inference, preprocessing, attention rollout, a command-line predictor and a setup README |
| Presentation outline | Slide-by-slide outline: problem, contributions, results, limitations and future work |
For your own report or slides, see dissertation, report & PPT support.
How could you adapt this project?
Keep the pipeline and change one thing, so your project has its own contribution. A lighter version (one model, the heatmap and a simple web page) can suit a B.Tech final year project; for more medical imaging topics, see our computer vision ideas among machine learning projects for final year.
Suggestions to discuss with your guide. The delivered work is the project above.
- Topic ideaTrain your own ensemble memberFine-tune a model on APTOS 2019 with a class-balanced loss and measure the change on mild and moderate grades.
- Topic ideaMulti-disease retinal screeningMove from five DR grades to multi-label diagnosis on RFMiD, including glaucoma and macular degeneration.
- Topic ideaSharper transformer explanationsCompare attention rollout with gradient-weighted methods and check which heatmaps match visible lesions.
- Topic ideaGrading on a phoneExport the models to ONNX, quantise them and grade fundus photos offline on a smartphone.
Frequently asked questions
Can I get a similar diabetic retinopathy detection project?
Yes. We build a new project around your own topic, dataset and guide’s requirements, such as another grading approach or another retinal disease. The scope is agreed in the free consultation.
Which datasets can a diabetic retinopathy detection project use?
Common public fundus datasets are APTOS 2019, EyePACS, Messidor and RFMiD. This project used two public pretrained checkpoints and openly licensed sample photos.
Do I need a GPU for a Vision Transformer project?
Not for this design: with no retraining, it ran on a laptop without a discrete GPU. Fine-tuning a ViT usually needs a cloud notebook GPU or a lab machine.
What will I need to explain in the viva?
Expect questions on how a ViT splits an image into patches, why two models with opposite biases make a useful ensemble, what Ben Graham preprocessing does, how attention rollout differs from Grad-CAM, and the limits of a small evaluation set.
Is this a medical diagnosis tool?
No. It is an academic prototype, and the app says so. Clinical use would need validation on graded patient images and regulatory approval.