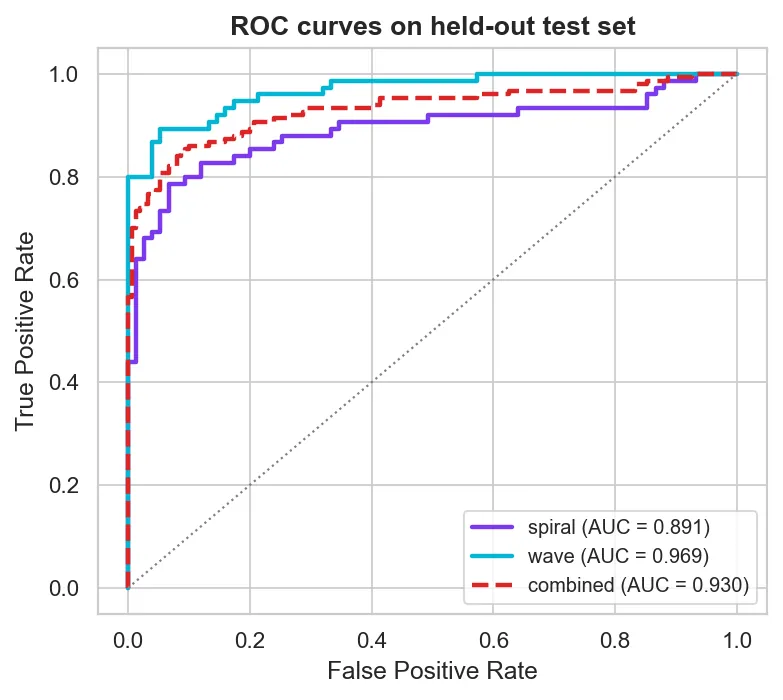
Every prediction comes with a Grad-CAM heatmap of the strokes that drove it, inside a React + Flask web app where you upload a drawing or sketch one in the browser. On a 300-image held-out test set, the combined system reached an ROC-AUC of 0.930.
What is this project, at a glance?
| Level | M.Tech |
|---|---|
| Domain | Medical AI, explainable AI (XAI) |
| Problem type | Binary image classification (healthy vs Parkinson’s) of hand-drawn spirals and waves |
| Core methods | Two EfficientNetB0 specialists, two-phase transfer learning from ImageNet, four-view test-time augmentation, Grad-CAM |
| Stack | Python, TensorFlow/Keras, Flask, OpenCV, React with Vite and Tailwind CSS |
| Deliverables | IEEE-format paper, M.Tech thesis, web app with trained models, two PPT decks, project guide with viva notes |
Why detect Parkinson’s disease from hand drawings?
Parkinson’s disease is diagnosed clinically, by a neurologist watching how a person moves, and in India most neurologists practise in large cities. Drawing tests are a cheap first check: tremor and small, cramped handwriting show up as wobbly spirals and uneven waves.
Many earlier studies train one model on every kind of drawing and report one accuracy, which hides which test is more reliable. This project asked a sharper question: does a separate model for each drawing type do better, and can every prediction be explained?
How does the spiral and wave drawing CNN work?
Two identical networks are trained, one on spirals and one on waves. At prediction time the app sends each drawing to the matching specialist.
Prepare the drawings
A public Kaggle dataset of spirals and waves, already split with equal classes. Augmentation stays gentle, because big rotations or zooms make a healthy spiral look shaky.
Start from a pretrained CNN
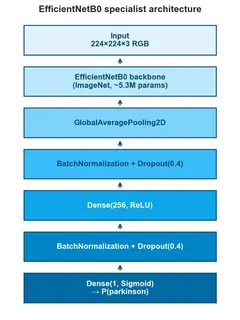
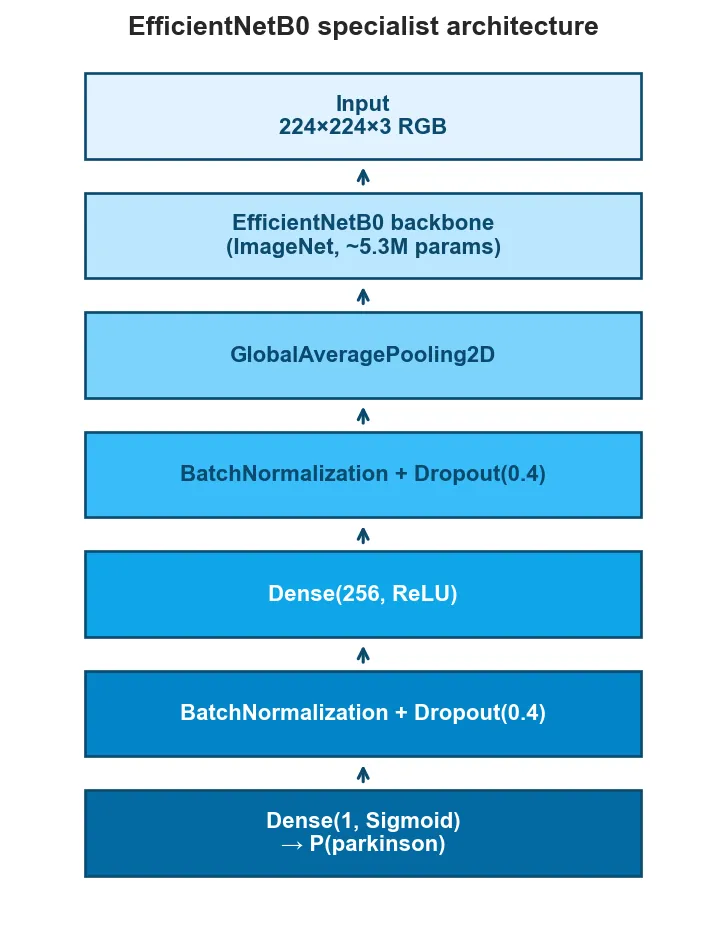
Each specialist is EfficientNetB0 pretrained on ImageNet, plus a small classification head. A compact backbone suits a small dataset that larger networks would overfit.
Train in two phases
First only the new head learns. Then the last backbone layers are unfrozen at a much lower learning rate, with early stopping.
Average four views
Each test drawing is scored as it is, flipped left-right, flipped upside down and flipped both ways, and the scores are averaged.
Show the evidence
Grad-CAM highlights the strokes that pushed the prediction towards Parkinson’s.
What does the web app with Grad-CAM heatmaps do?
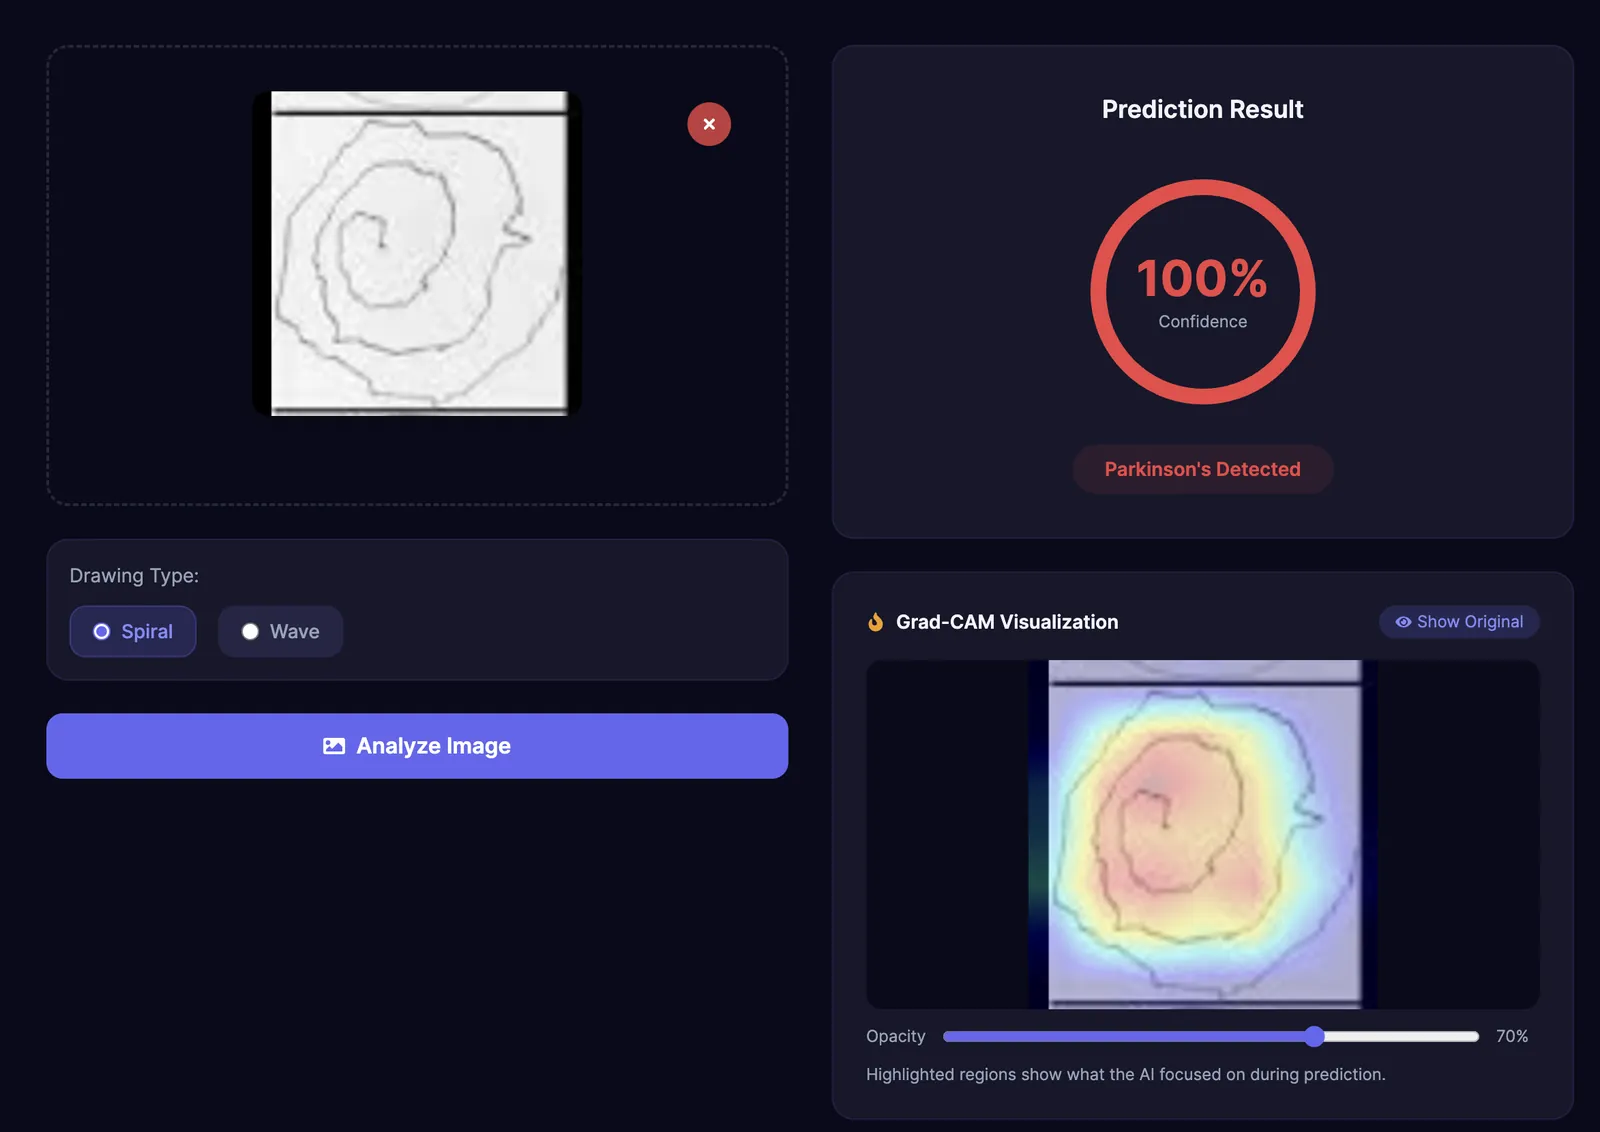
A React front end talks to a Flask API that loads both specialists. You choose Spiral or Wave, upload a drawing or sketch one on the in-browser canvas, and get the class, a confidence gauge and the Grad-CAM overlay with an opacity slider. A dashboard shows the training curves and metrics.
Each specialist is a separate model file, so either one can be retrained without touching the other.
Shown with student, guide and institute details removed.
What did the results show?
All results come from 300 held-out test drawings the models never saw in training.
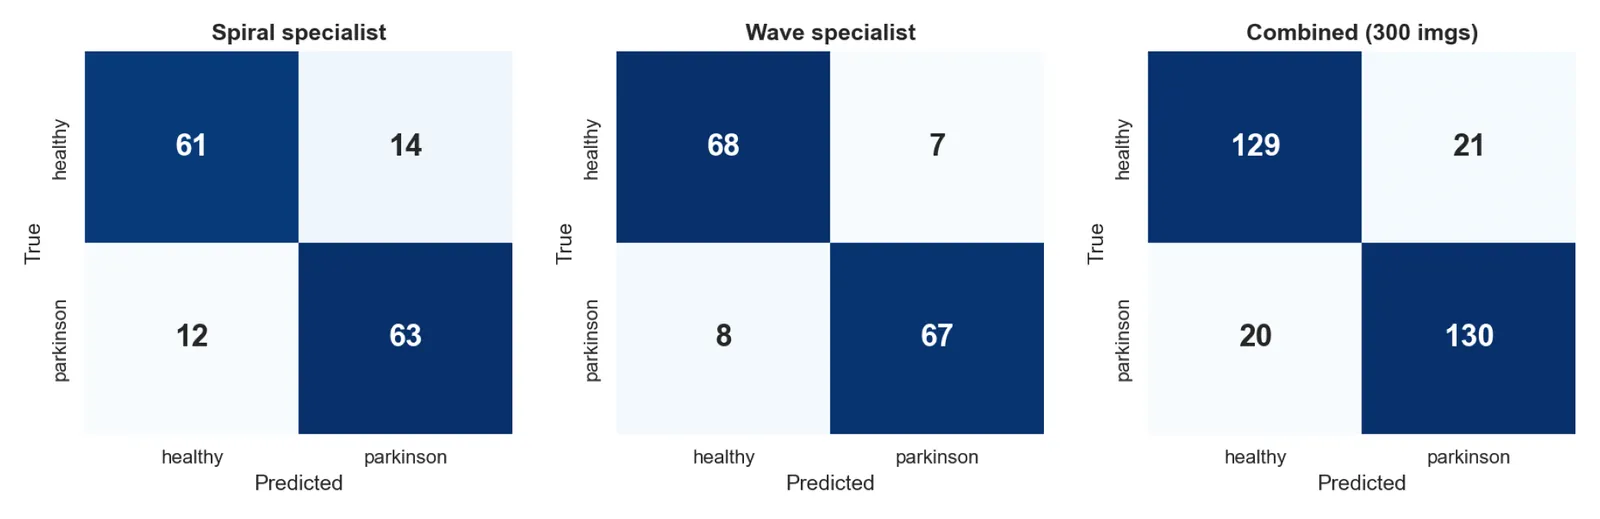
- Waves were easier to read. The wave model separated the classes best (AUC 0.969), ahead of the spiral model (AUC 0.891); the combined system reached 0.930.
- Fewer mistakes on waves. The confusion matrices show clearly fewer errors for the wave model, so the wave test is the safer choice when a clinic can collect only one drawing.
Why two models instead of one?
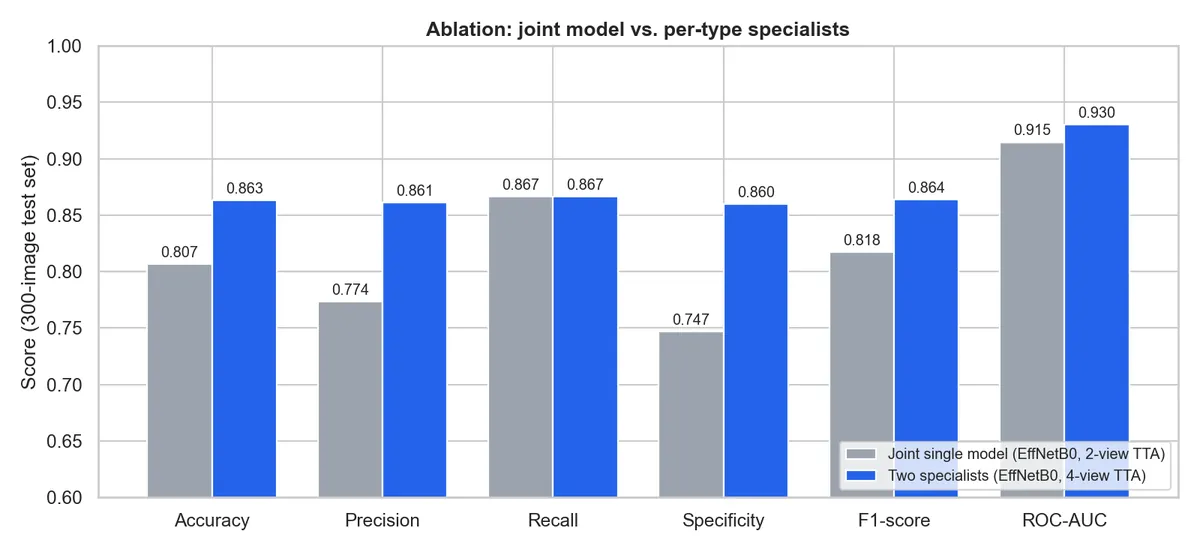
In the ablation, a single joint model was trained on both drawing types. The two specialists beat it on accuracy, precision, specificity, F1 and ROC-AUC, and matched it on recall.
Why was validation accuracy higher than test accuracy?
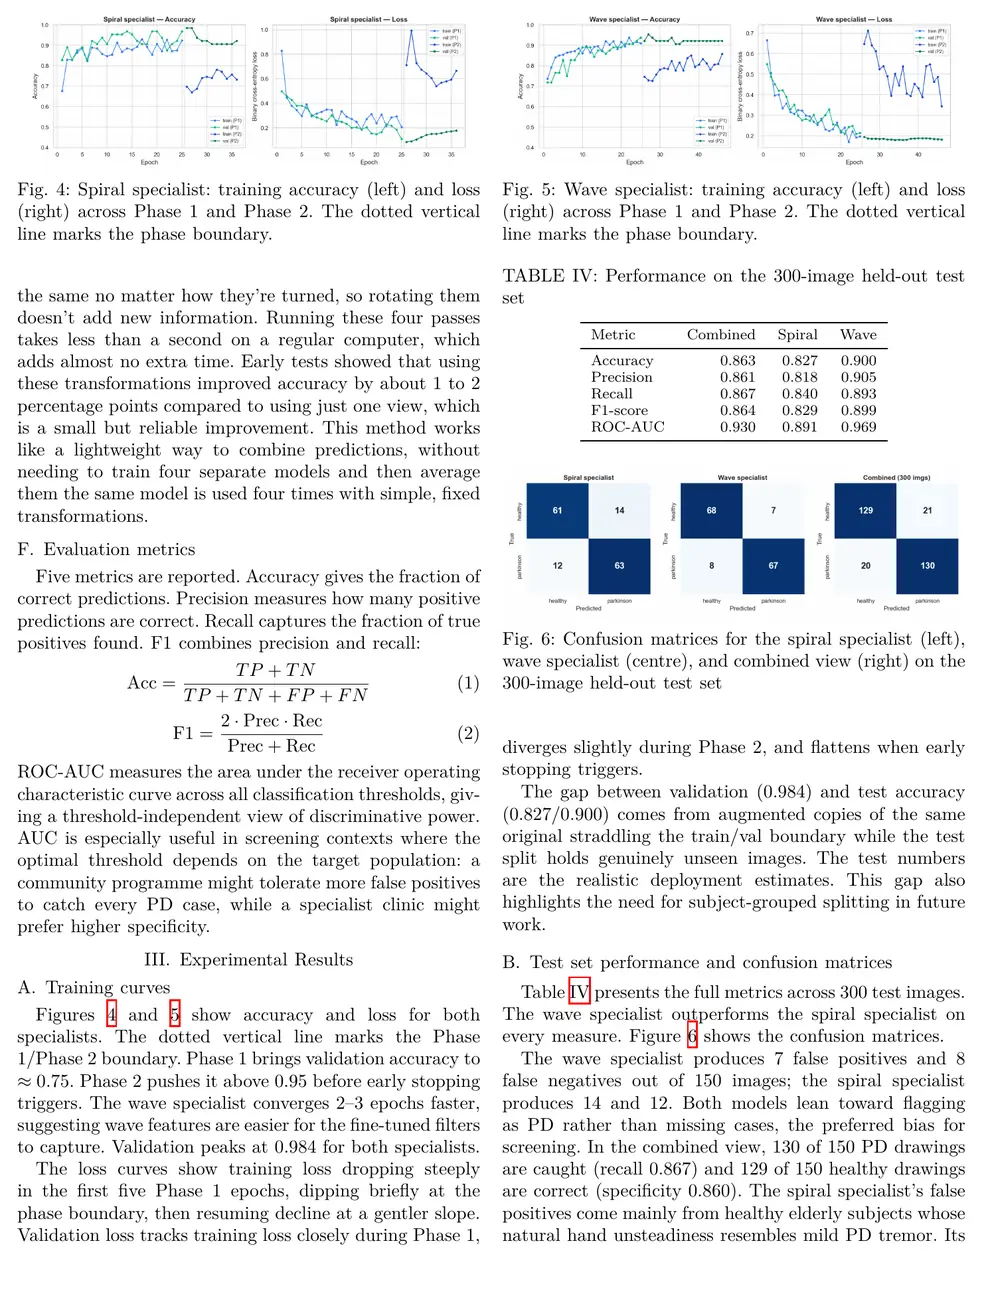
The dataset was augmented before it was split, so altered copies of one drawing could sit in both training and validation. The unseen test set gives the realistic numbers, and splitting by person is the fix the paper proposes. Expect this question in the viva.
Shown with student, guide and institute details removed.
What did the student receive?
Everything needed to run, submit and defend the project, including a paper written to the IEEE paper format.
| Deliverable | What it contains |
|---|---|
| IEEE-format paper | LaTeX source and PDF: method, results, ablation and comparison with published methods |
| M.Tech thesis | Project report in LaTeX and PDF, in two formatted versions |
| Web app and models | React + Flask app, both trained specialists, the training script and a README |
| Presentations | Two PPT decks, a standard and an extended version |
| Project guide | Plain-language notes on the folders, run steps and viva key terms |
For your own thesis or slides, see dissertation, report & PPT support.
The paper positions the system as a first-pass filter that refers people to a neurologist.
How could you adapt this project?
Keep the two-specialist design and change one part, so your project makes a contribution of its own. A simpler version (one CNN, Grad-CAM and a basic web page) is a realistic B.Tech final year project. If your guide prefers Parkinson’s disease detection using machine learning rather than deep learning, the pen-signal idea below suits classic models such as random forests, and our list of machine learning projects for final year has more medical AI topics.
Suggestions to discuss with your guide. The delivered work is the project above.
- Topic ideaFuse spiral and wave per personCombine both specialists’ scores for people who drew both, and test whether the fused score beats either drawing alone.
- Topic ideaSplit by person, not by imageKeep each person’s drawings in one split, add k-fold cross-validation and compare the results.
- Topic ideaAdd pen speed and pressureUse tablet-recorded handwriting such as PaHaW and combine pen-movement signals with CNN image features.
- Topic ideaScreening on a phoneConvert a specialist to TensorFlow Lite so people can draw on a phone and get an on-device result.
Frequently asked questions
Can I get a similar Parkinson’s disease detection project?
Yes. We build a new project around your own topic, dataset and guide’s requirements, such as another handwriting test, voice data or a different explanation method. The scope is agreed in the free consultation.
Which dataset does a spiral drawing Parkinson’s project use?
This one used a public Kaggle dataset of spirals and waves drawn by healthy people and people with Parkinson’s. Tablet datasets such as PaHaW add pen speed and pressure.
What does Grad-CAM show?
A heatmap of the strokes that pushed the model towards Parkinson’s, often the outer spiral loops and the wave peaks. It shows the model is looking at the drawing, not the paper edges.
What will I need to explain in the viva?
Transfer learning and the two training phases, why EfficientNetB0 suits a small dataset, test-time augmentation, precision, recall and ROC-AUC, why waves beat spirals, and why validation accuracy was higher than test accuracy.
Can this be a B.Tech final-year project?
A simpler version can: one CNN with Grad-CAM and a basic web page. The two-specialist design, the ablation study and the IEEE-format paper made this one an M.Tech project.