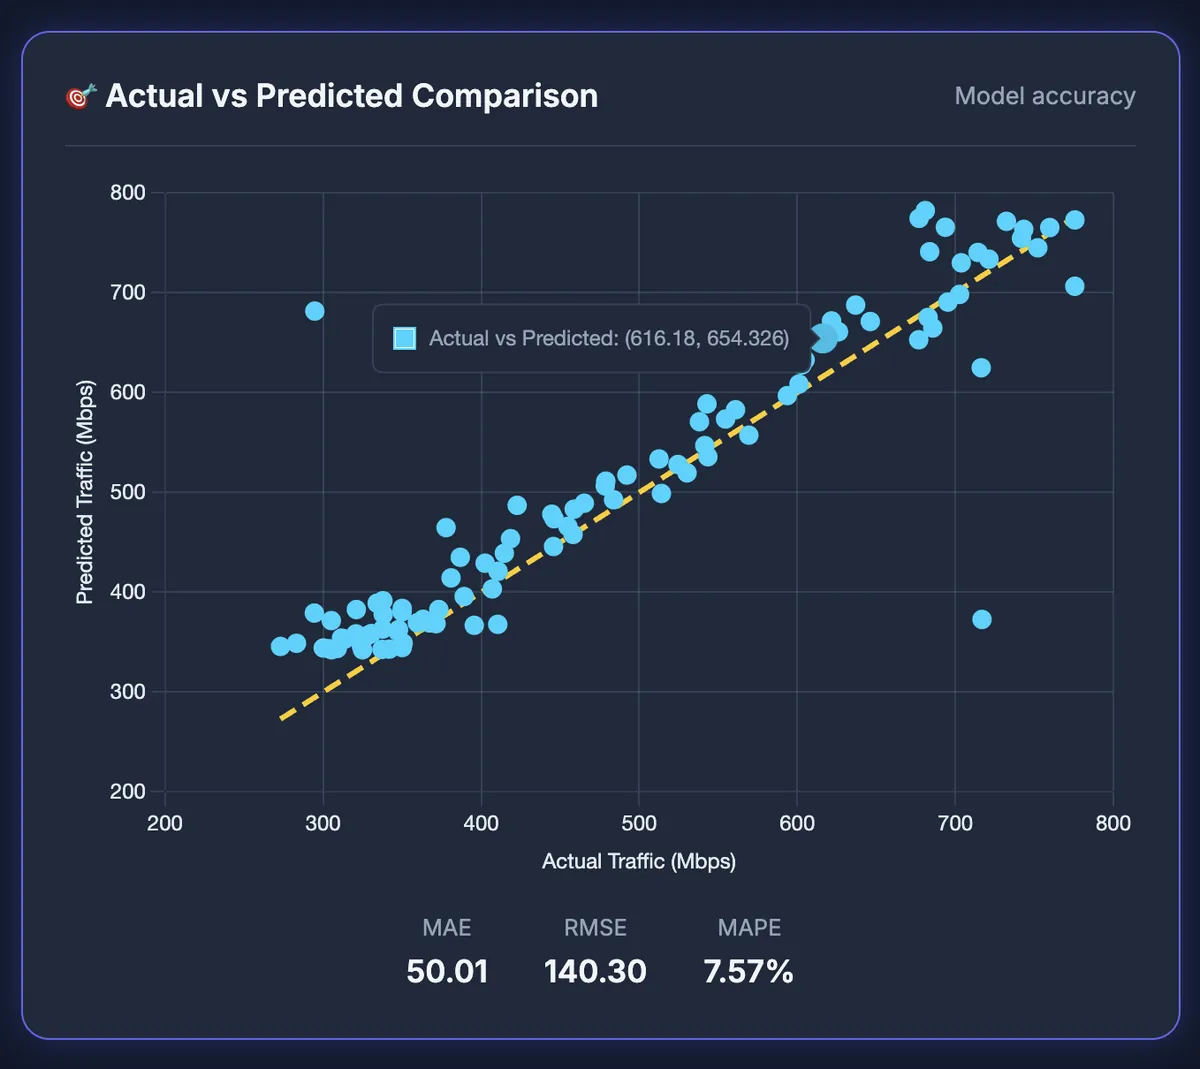
On held-out data the forecasts scored MAE 50.01, RMSE 140.30 and MAPE 7.57%. The student received the code, the web dashboard, an IEEE-format paper and the M.Tech thesis.
What is this project, at a glance?
A network traffic forecasting system for wireless networks that predicts load, watches service quality and raises alerts before congestion builds. It is an M.Tech project in deep learning for computer networks.
| Level | M.Tech |
|---|---|
| Domain | Deep learning for networks: traffic forecasting, QoS analytics, anomaly detection |
| Problem type | Multi-step time-series forecasting plus anomaly detection |
| Core methods | Two-layer Bi-LSTM; Linear Regression and Random Forest as lighter fallbacks; a hybrid two-sigma and prediction-error anomaly detector |
| Stack | Python, TensorFlow / Keras, scikit-learn, pandas, NumPy, Flask, Chart.js |
| Deliverables | Source code, Flask web dashboard with REST API, IEEE-format paper, M.Tech thesis |
What problem does network traffic prediction solve?
Most networks are managed reactively: an operator sees congestion after users already feel it. If you can forecast the next hour of traffic, you can add capacity, reroute or throttle before the peak arrives.
The difficulty is that traffic is bursty and non-linear. It has daily peaks, sudden spikes and slow growth, so classical models such as ARIMA, which assume a stable linear series, struggle. The brief was to forecast at five-minute resolution, catch abnormal events, and put both in front of an operator through a dashboard and an API. That made network traffic prediction using deep learning the main approach, with classic machine learning models kept as baselines and fallbacks.
How does the Bi-LSTM forecasting approach work?
The pipeline runs in five stages, from raw readings to an operator's screen.
Clean and normalise
Traffic volume, latency, throughput, packet loss, jitter and signal strength are logged every five minutes. Gaps are filled, outliers clipped and values scaled to 0–1.
Engineer features
Hour of day and a weekend flag capture the daily cycle; a rolling mean, the rate of change and an anomaly score are derived from the series.
Forecast with the Bi-LSTM
Two stacked bidirectional LSTM layers read the last two hours and predict every five-minute step of the next hour, with dropout, early stopping and learning-rate scheduling against overfitting.
Detect anomalies
A reading is flagged if it lies outside two standard deviations of normal traffic, or if it misses the model's forecast by far more than usual.
Serve the results
A Flask REST API returns forecasts, QoS metrics, anomalies and a health score, and the dashboard draws them live.
Why bidirectional, and why keep simpler models?
The backward pass runs only inside the past input window, so the model sees each step with context from both sides without looking into the future. Linear Regression and Random Forest stay in the system as a fallback: a confidence-based selector uses the Bi-LSTM normally and switches to a lighter model when input is incomplete or resources are tight.
What does the live QoS dashboard show?
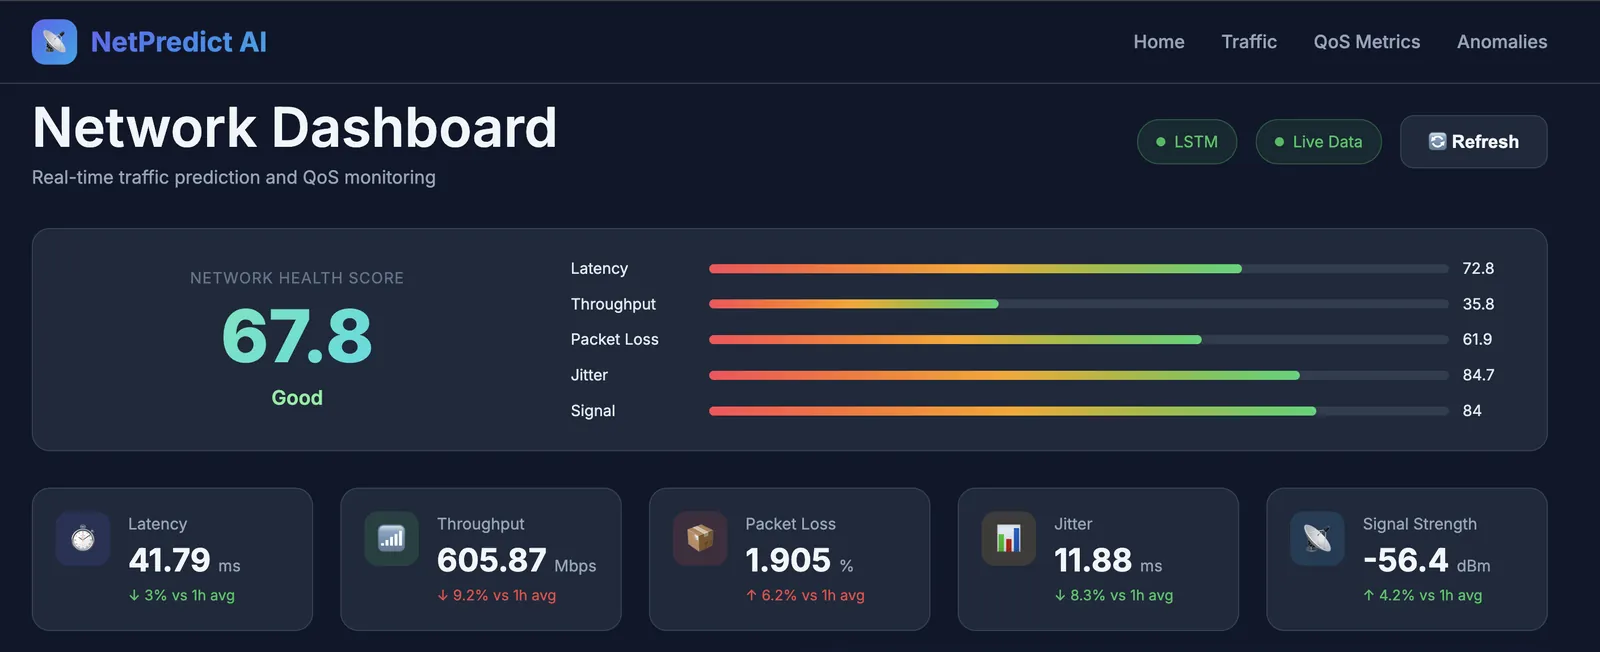
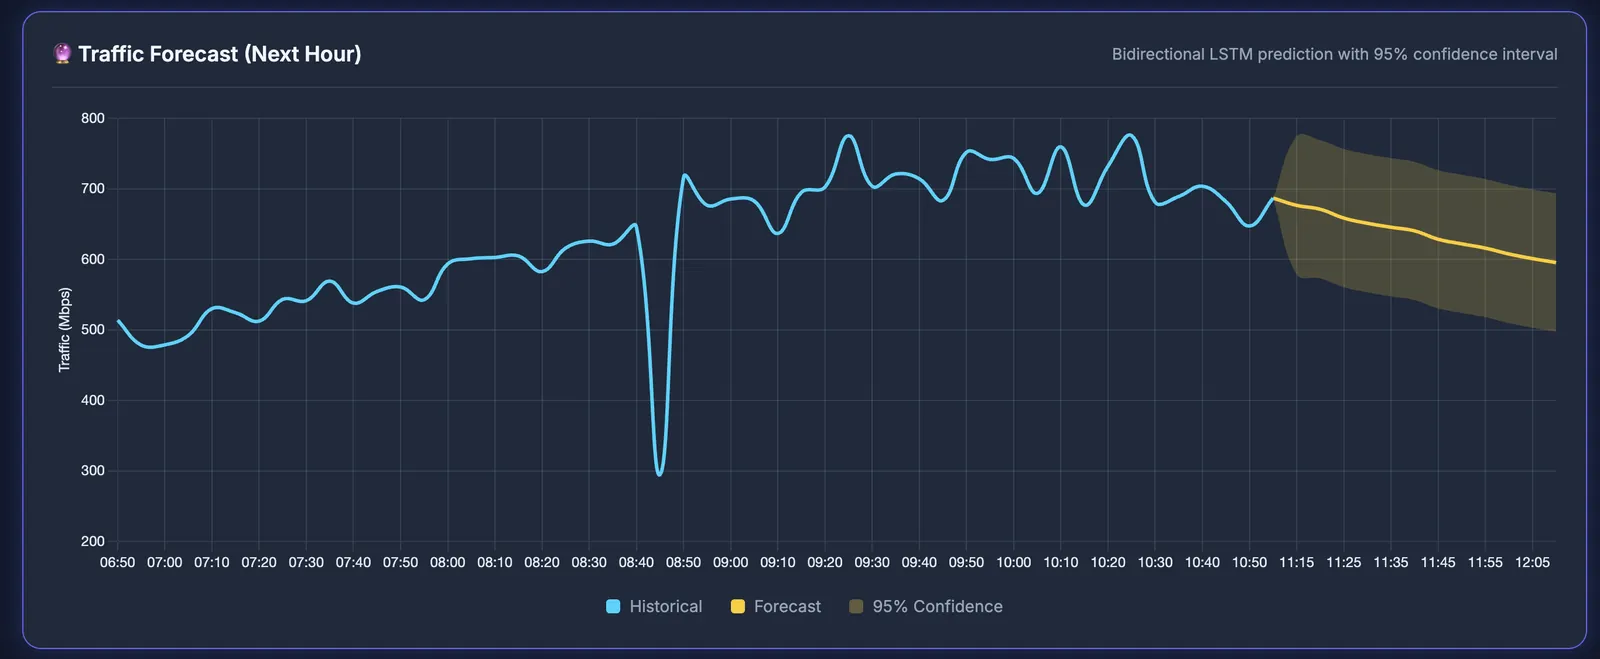
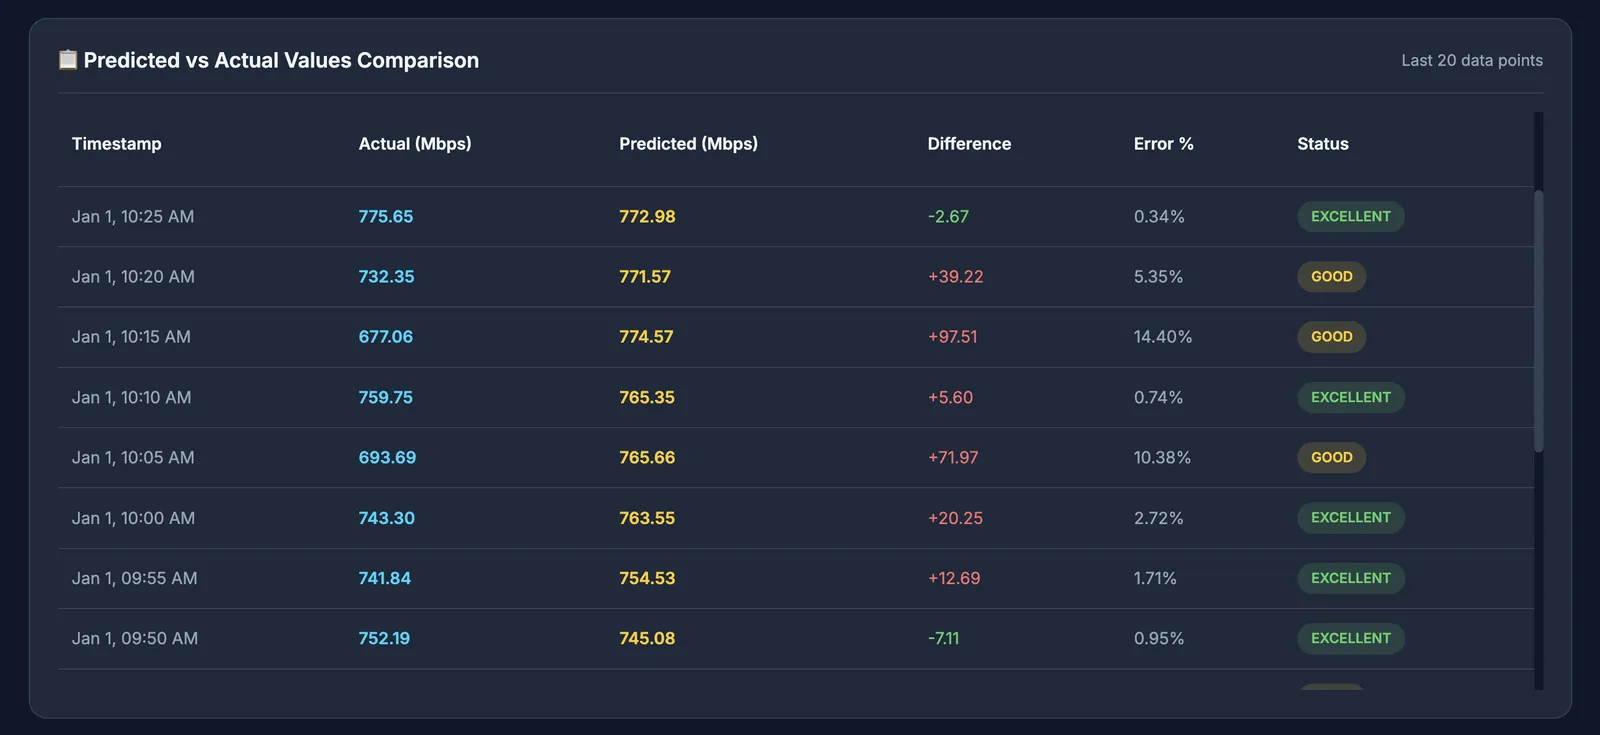
The dashboard gives an operator one screen: current KPIs, a single Network Health Score built from five normalised sub-scores, the next-hour forecast with a confidence band, and a table comparing each forecast with what actually happened.
What results did the model achieve?
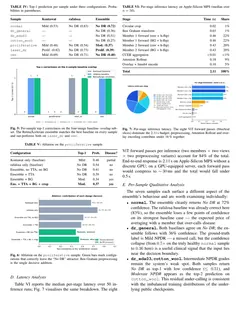
On data held out in time order, the forecasts scored MAE 50.01, RMSE 140.30 and MAPE 7.57%. RMSE sits well above MAE because squaring punishes a handful of large misses during traffic spikes, while most points hug the perfect-prediction line.
- Baselines: the Bi-LSTM beat ARIMA, SARIMA, Linear Regression, Random Forest and a one-direction LSTM on every metric, trained on the same features and split.
- Ablation: removing the bidirectional layer or the derived features hurt accuracy the most.
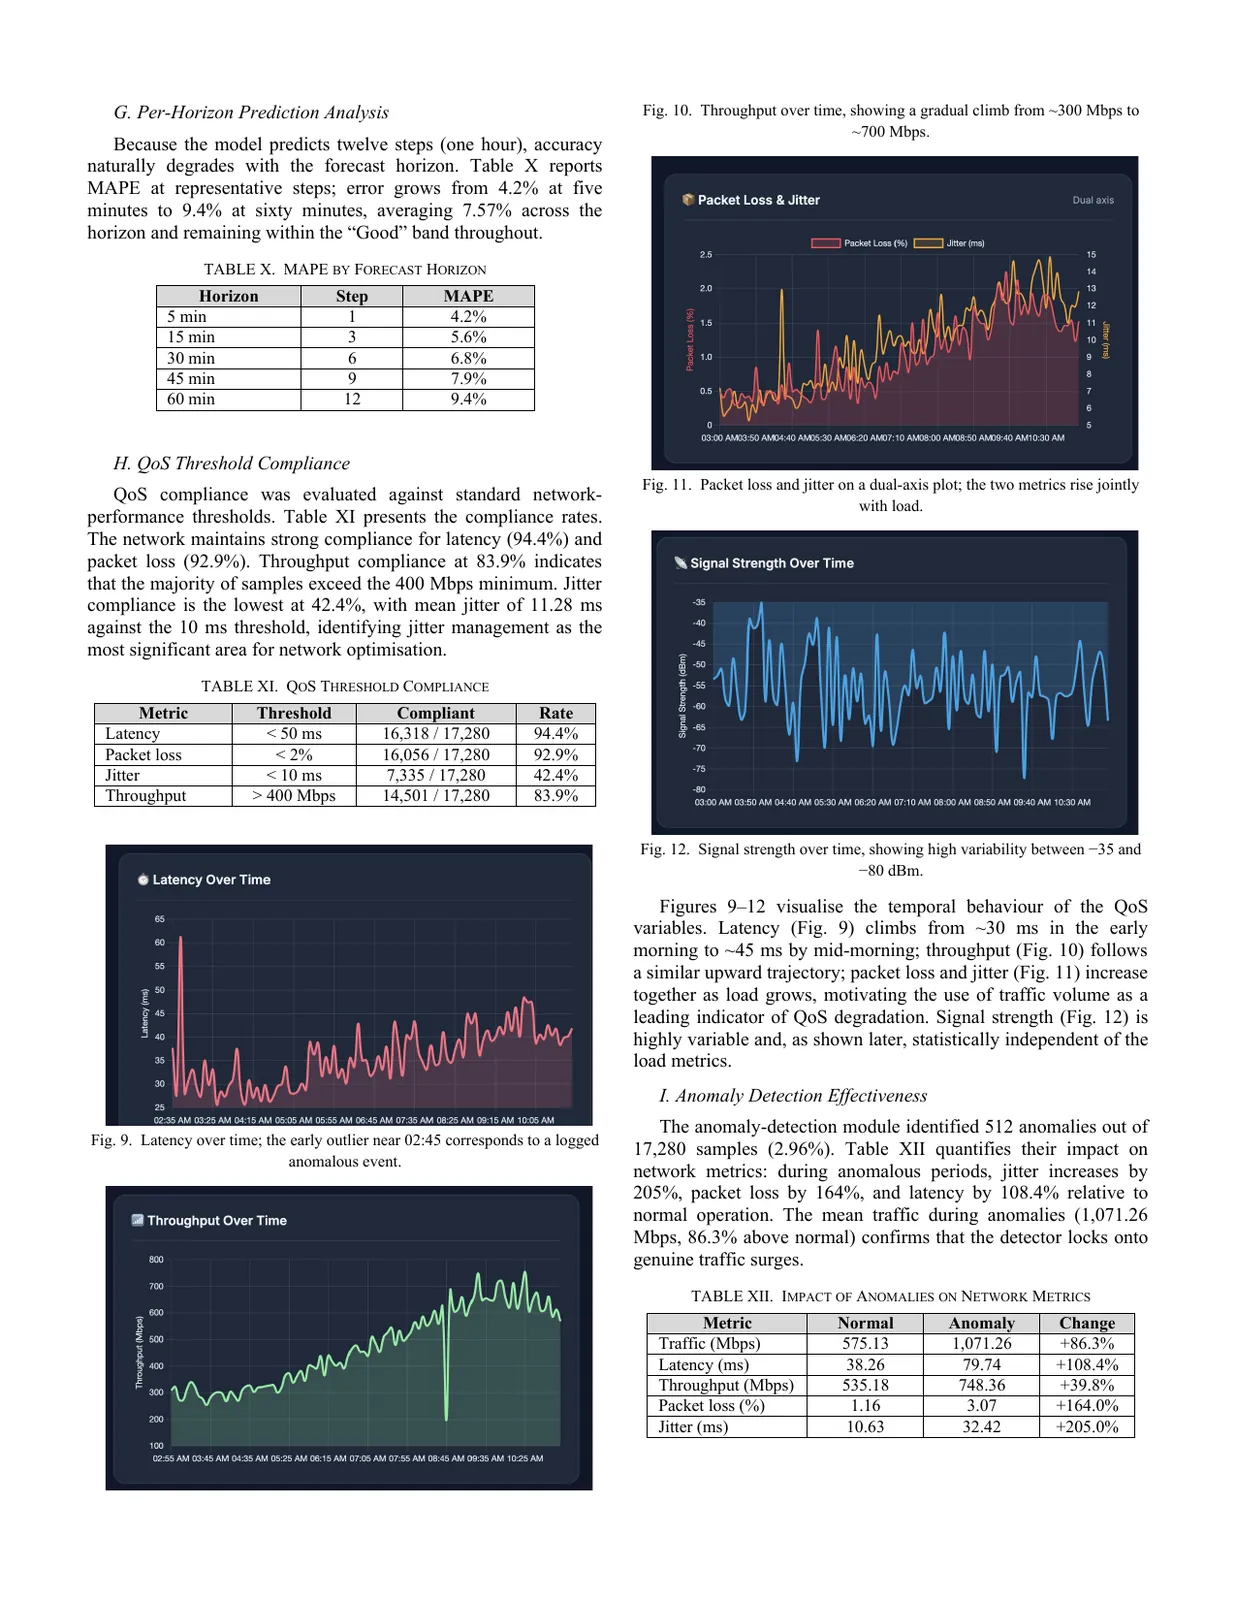
- Forecast horizon: error grows the further ahead the model looks, as expected, but stays within the dashboard's "Good" band across the hour.
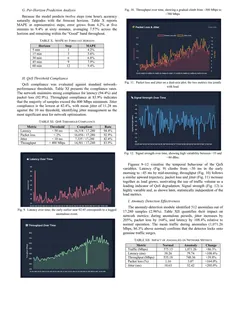
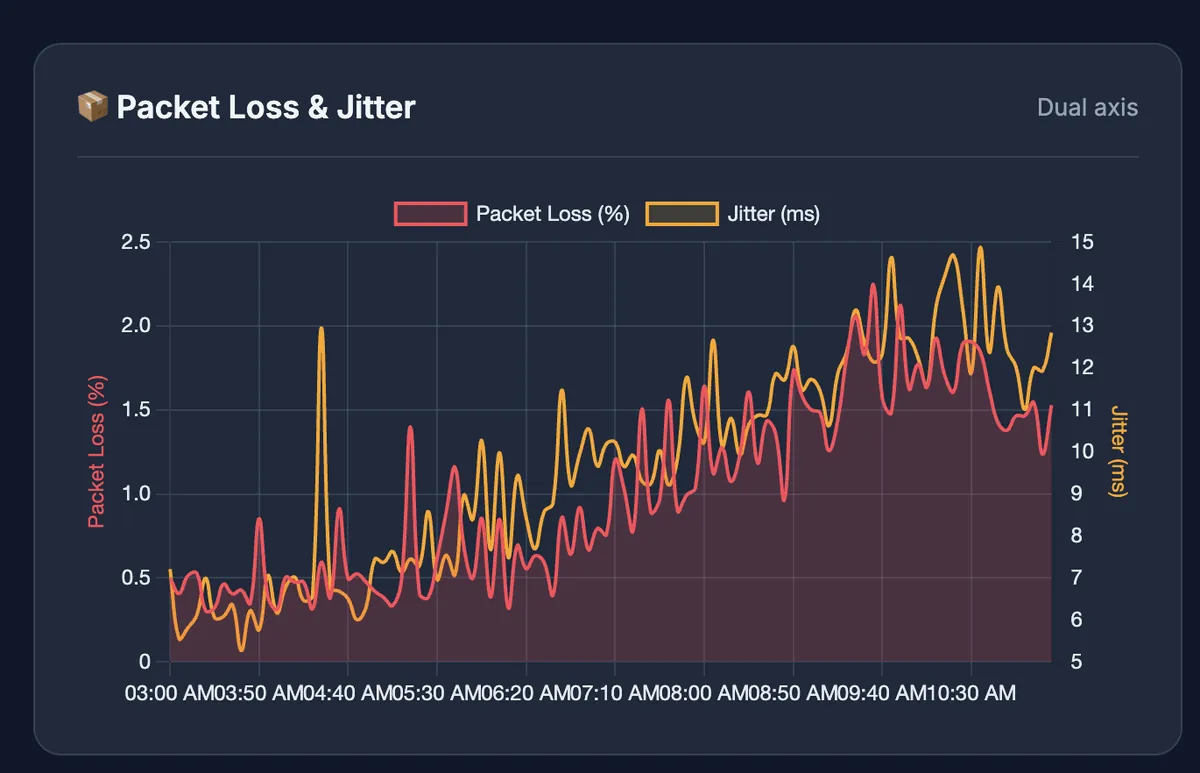
- QoS: packet loss and jitter rise together with load, and jitter was the metric that most often missed its target.
- Anomalies: the combined detector was more precise and caught more real events than either test alone; flagged events clustered around the morning and evening peaks and a late-night window.
Shown with student, guide and institute details removed.
What did the student receive?
| Deliverable | What it contains | Format |
|---|---|---|
| Source code | Data preparation, a sample-data generator, Bi-LSTM training, the anomaly detector and the Flask app with its REST endpoints | Python project |
| Web dashboard | KPI tiles, health score, forecast chart, predicted-vs-actual table, anomaly panels | Flask, HTML, Chart.js |
| IEEE-format paper | Method, baselines, ablation, per-horizon error, QoS compliance and anomaly analysis | PDF and DOCX |
| M.Tech thesis | Full report in the institute's format, with results chapters and figures | LaTeX and PDF |
Deliverables are listed as they appear in the project files. The paper follows the two-column IEEE paper format. For your project, a PPT and a viva walkthrough can be added to the scope; see dissertation, report and PPT support.
Our work is building, writing support, guidance and explanation. Use it to learn and to prepare your own submission, and check what your university allows before you submit.
How could you adapt this project for your own topic?
The same pipeline carries over to other networking problems. Each of these would give your project its own contribution; for more time-series topics, see the deep learning section of our machine learning projects for final year.
The ideas below are suggestions to discuss with your guide. Our delivered work is in the case studies.
- Topic ideaTransformer vs Bi-LSTM for 5G cell trafficCompare a temporal transformer with the Bi-LSTM on cell-level mobile traffic at several forecast horizons.
- Topic ideaSpatio-temporal forecasting with a graph networkModel neighbouring base stations as a graph so each cell's forecast uses its neighbours' load.
- Topic ideaFederated traffic forecastingTrain one model across several routers without pooling their raw logs, and measure the accuracy cost.
- Topic ideaForecast-driven bandwidth allocationFeed the forecasts to a scheduler in a network simulator and show fewer QoS violations than a reactive policy.
Frequently asked questions
Can I get a similar network traffic prediction project?
Yes. In a free consultation we fit the idea to your topic, data, level and deadline, and you get a written plan and a fixed quote before any work starts. The scope can include the code, a dashboard, an IEEE-format paper and your report, and you should check what your institution allows before you submit.
Which datasets can I use for network traffic prediction?
Any time-stamped series of traffic volume works. This project worked with a time series of traffic and QoS values (latency, throughput, packet loss, jitter, signal strength) at five-minute intervals, and its code ships with a generator for a sample series, so the pipeline runs end to end without private network logs. For your version, logs from your lab router or Wireshark captures, or public sets such as the Telecom Italia Milan mobile traffic data, are common choices.
Why use a Bi-LSTM instead of ARIMA or a plain LSTM?
ARIMA-style models assume the series is linear and stable, which bursty network traffic is not. An LSTM learns non-linear patterns over time, and the bidirectional version reads each input window in both directions. In this project the Bi-LSTM beat ARIMA, SARIMA, Linear Regression, Random Forest and a one-direction LSTM on the same data split.
What will I need to explain in the viva?
Expect questions on how the series is cut into windows, why the train and test split follows time order, why a bidirectional layer does not see the future, what MAE, RMSE and MAPE each tell you, how the two anomaly tests combine, and how the Network Health Score is built. A walkthrough session covers each of these.
Can this be done as a B.Tech final-year project?
This one was delivered at M.Tech level, with baselines, an ablation study and a paper. A smaller scope, such as one LSTM model and a simple dashboard, is a realistic final-year project for B.Tech or B.E. students.