It compares Random Forest and XGBoost on one pipeline and uses SMOTE because failures are rare. Stage-I delivered the problem, literature review, research gaps and a full methodology, with the report, two presentations and all method figures; training and results come in Stage-II.
What is this project, at a glance?
A Stage-I dissertation for a postgraduate engineering degree: it defines the problem and fixes every step of the method, so Stage-II can go straight to implementation.
| Level | M.E. / M.Tech, Dissertation Stage-I |
|---|---|
| Domain | Machine learning for manufacturing (Industry 4.0 predictive maintenance) |
| Problem type | Binary classification (failure or no failure) on imbalanced tabular sensor data |
| Core methods | Random Forest, XGBoost, SMOTE and class weighting, cross-validated tuning, SHAP explanations |
| Stack | Python; planned for Stage-II: pandas, scikit-learn, XGBoost, imbalanced-learn, SHAP, Flask or Streamlit |
| Deliverables | Stage-I report, seminar PPT, detailed PPT, method figures |
What problem does predictive maintenance using machine learning solve?
Machine tools already log air and process temperature, spindle speed, torque and tool wear, yet most plants still repair after a breakdown or replace parts on a fixed schedule. One is too late; the other throws away good parts. Predictive maintenance acts only when the data says failure is near.
The literature review found two recurring weaknesses. Failures are a tiny share of the records, so a model that always answers "no failure" looks accurate while catching nothing. And models are rarely explained, so an engineer cannot check an alert before stopping a line. The review also found no like-for-like comparison of Random Forest and XGBoost on the same pipeline for this dataset.
How does the Random Forest vs XGBoost approach work?
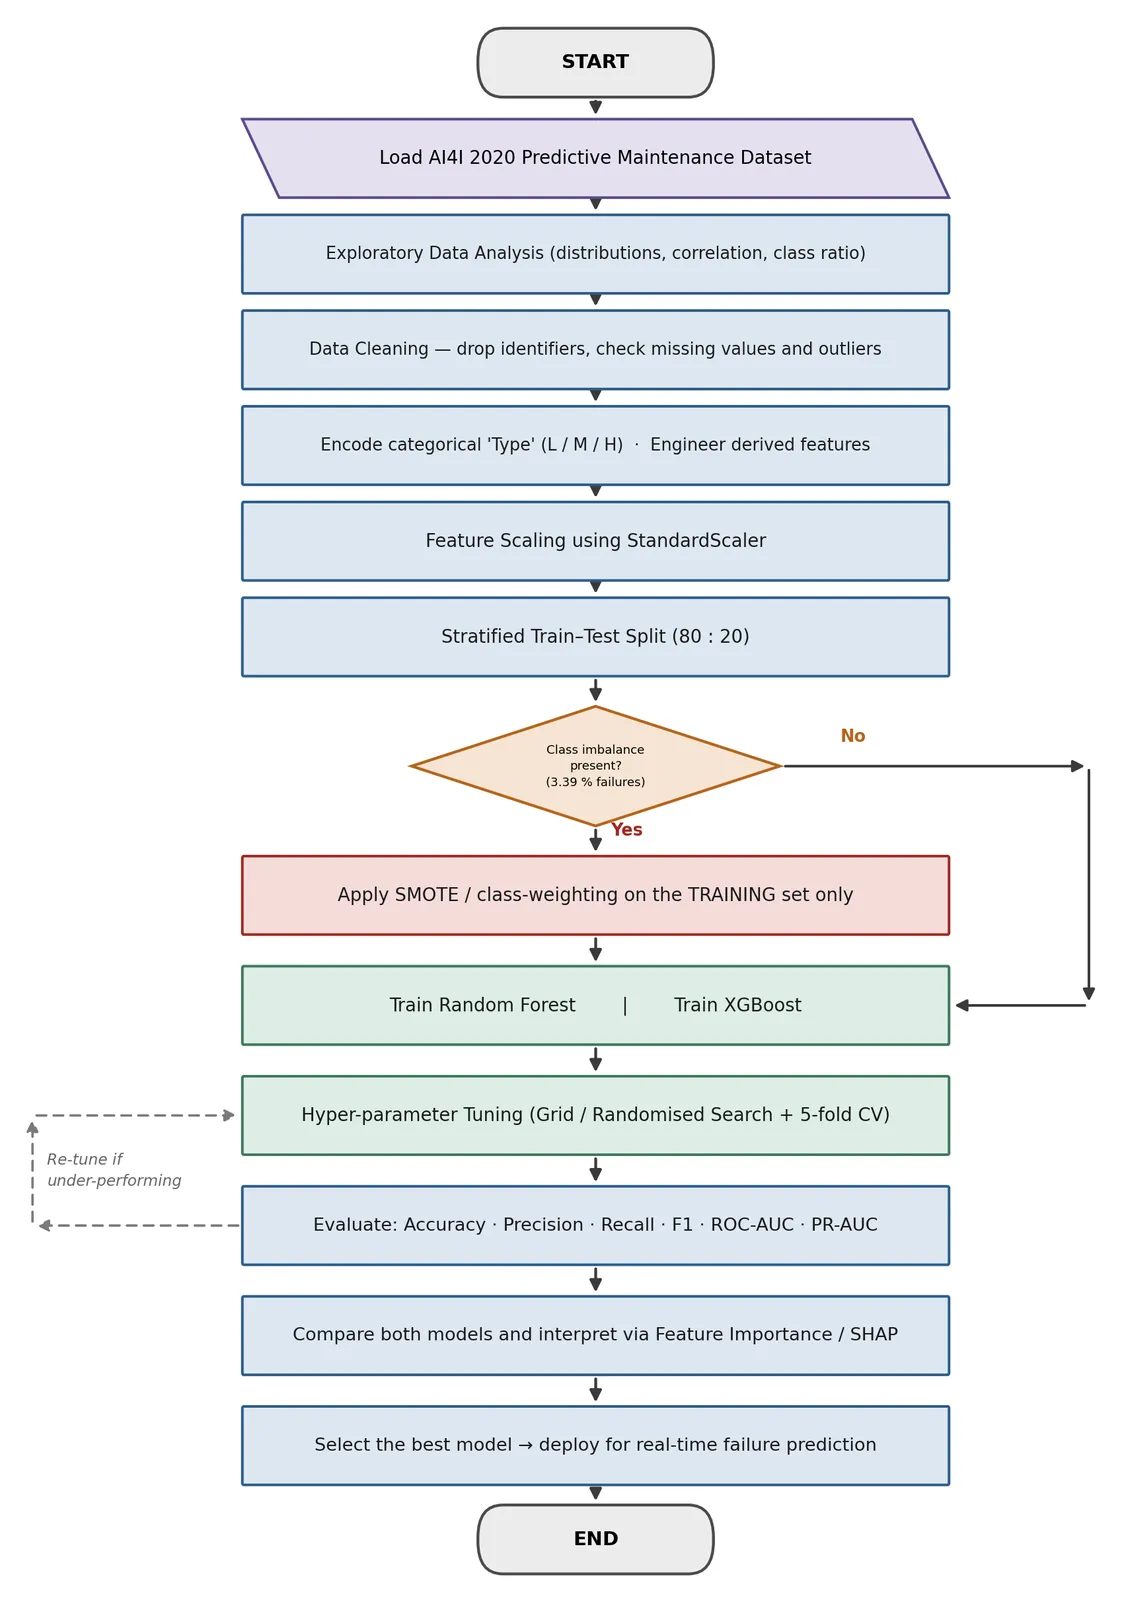
The proposed system has five layers: data, pre-processing, modelling, evaluation, and interpretation with a simple prediction interface.
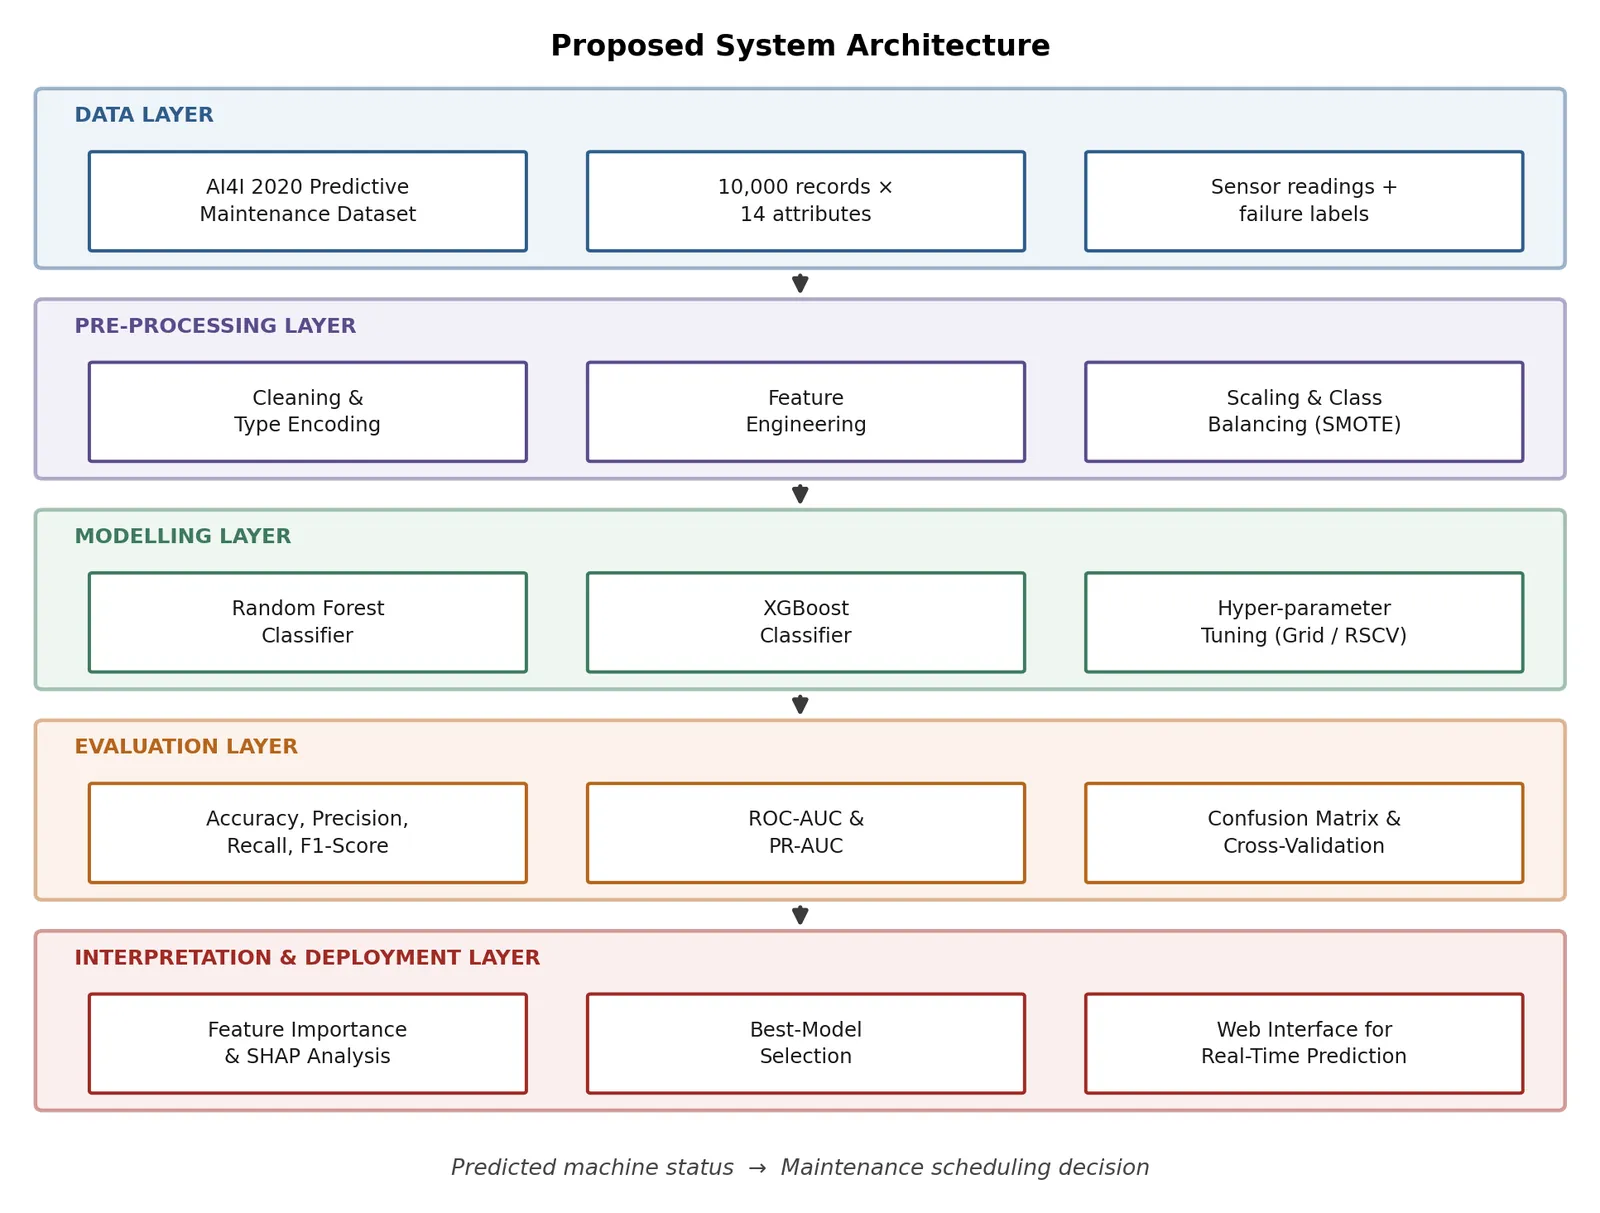
- Features tied to failure modes. Temperature difference points to heat-dissipation failure, torque times speed gives power, and tool wear times torque signals overstrain.
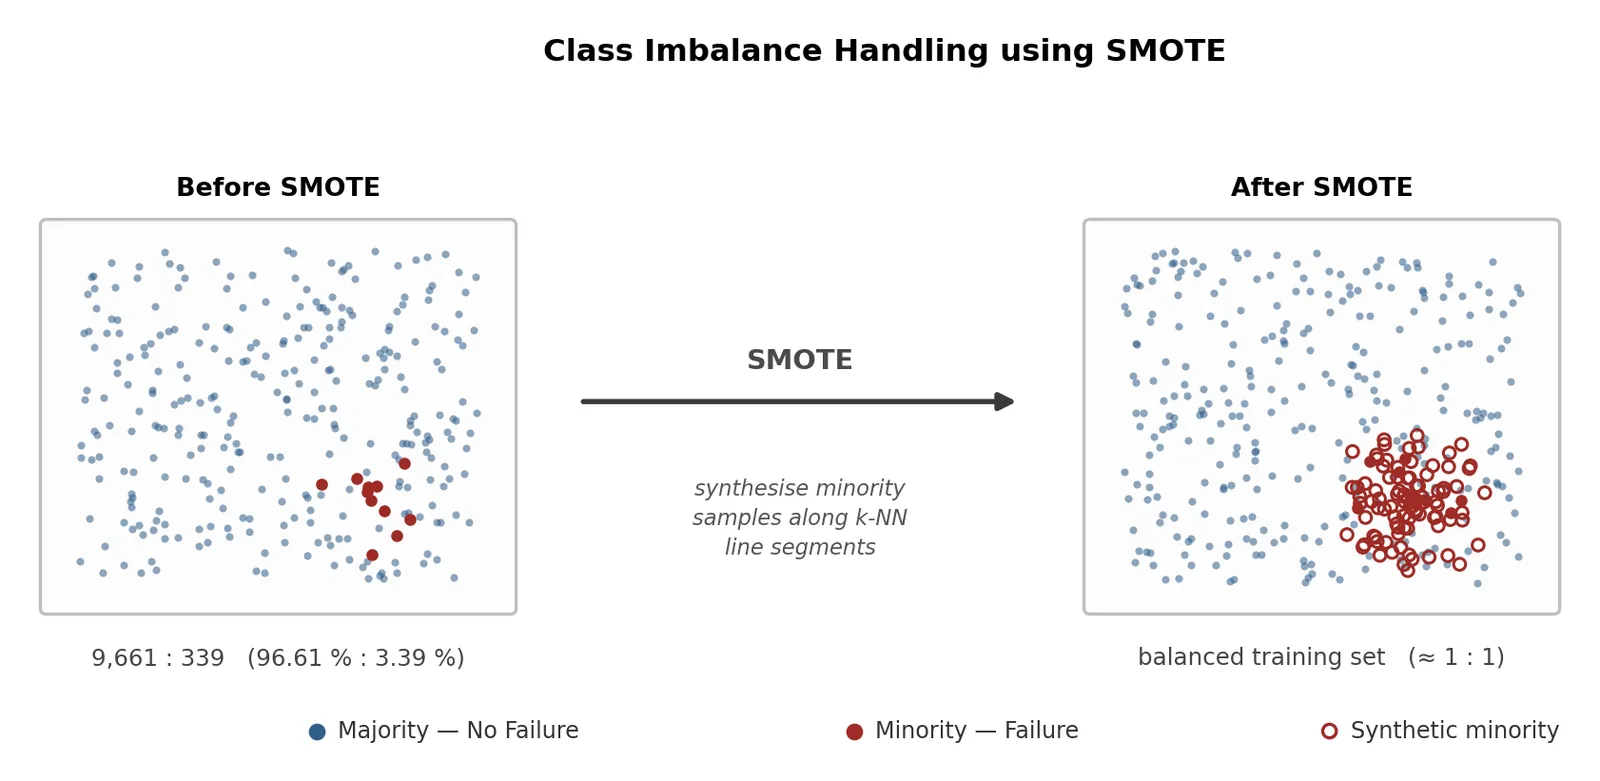
- Imbalance handled without leakage. SMOTE and class weights are applied to the training split only, so no synthetic sample reaches the test set.
- A fair comparison. Both models share one pipeline, one stratified split and one tuning procedure (randomised then grid search with stratified cross-validation), optimised for the failure class's F1-score.
- Explained predictions. Feature importance and SHAP show which readings drive each alert.
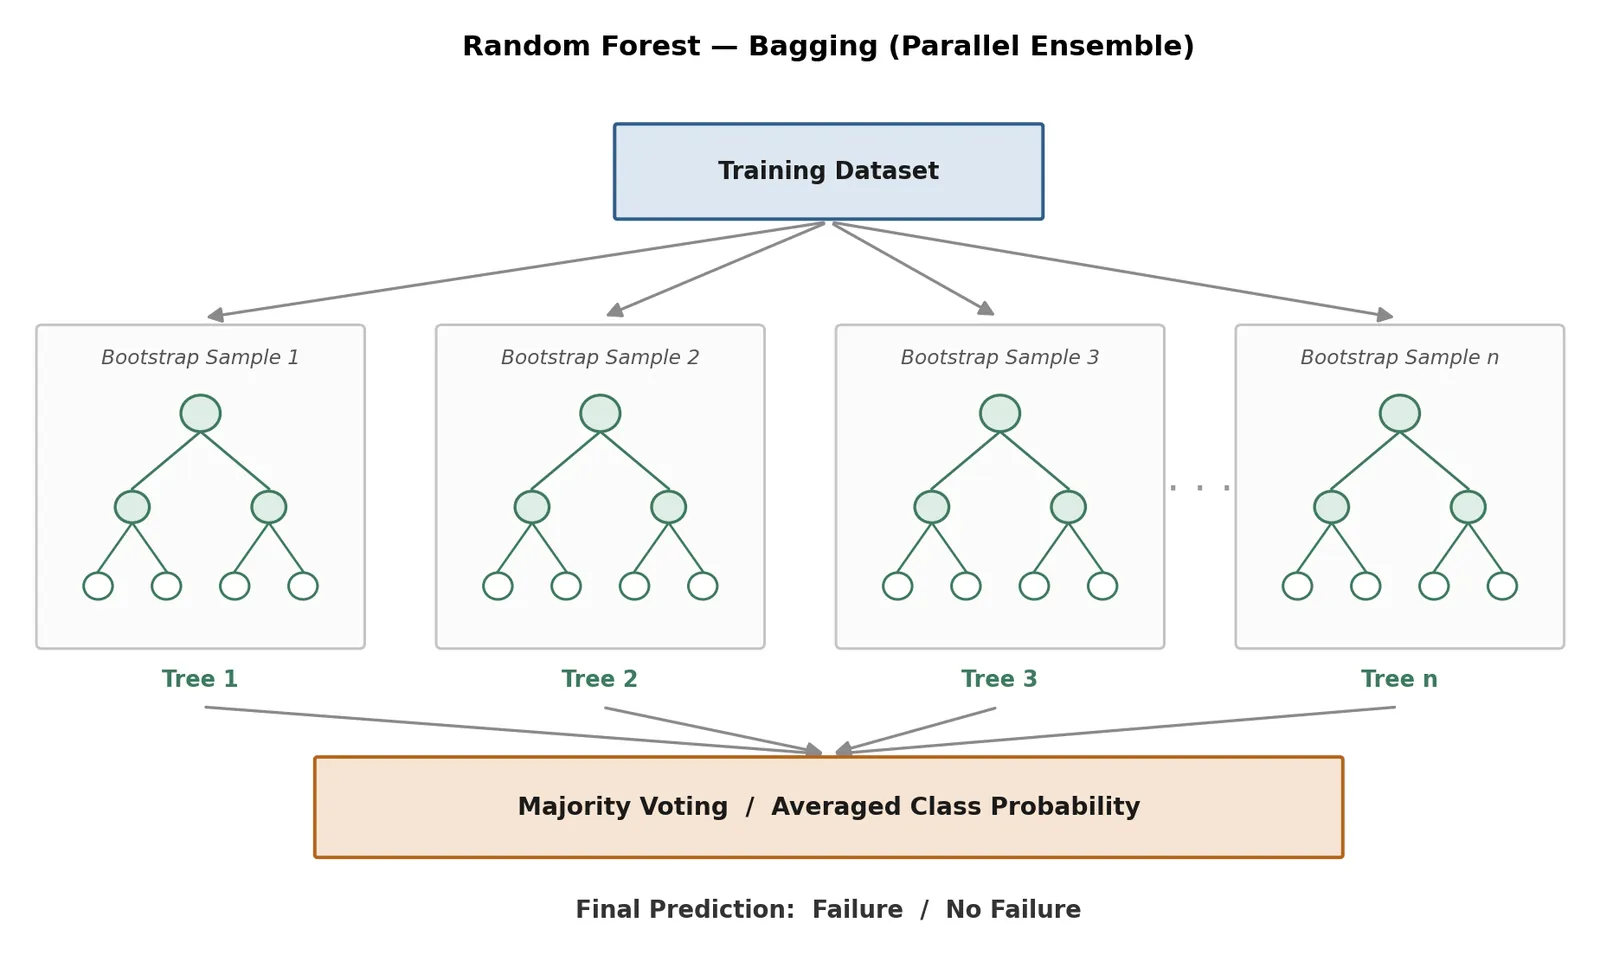
Random Forest vs XGBoost: why compare them?
The two algorithms fix different weaknesses, which makes the comparison informative rather than a formality.
| Aspect | Random Forest | XGBoost |
|---|---|---|
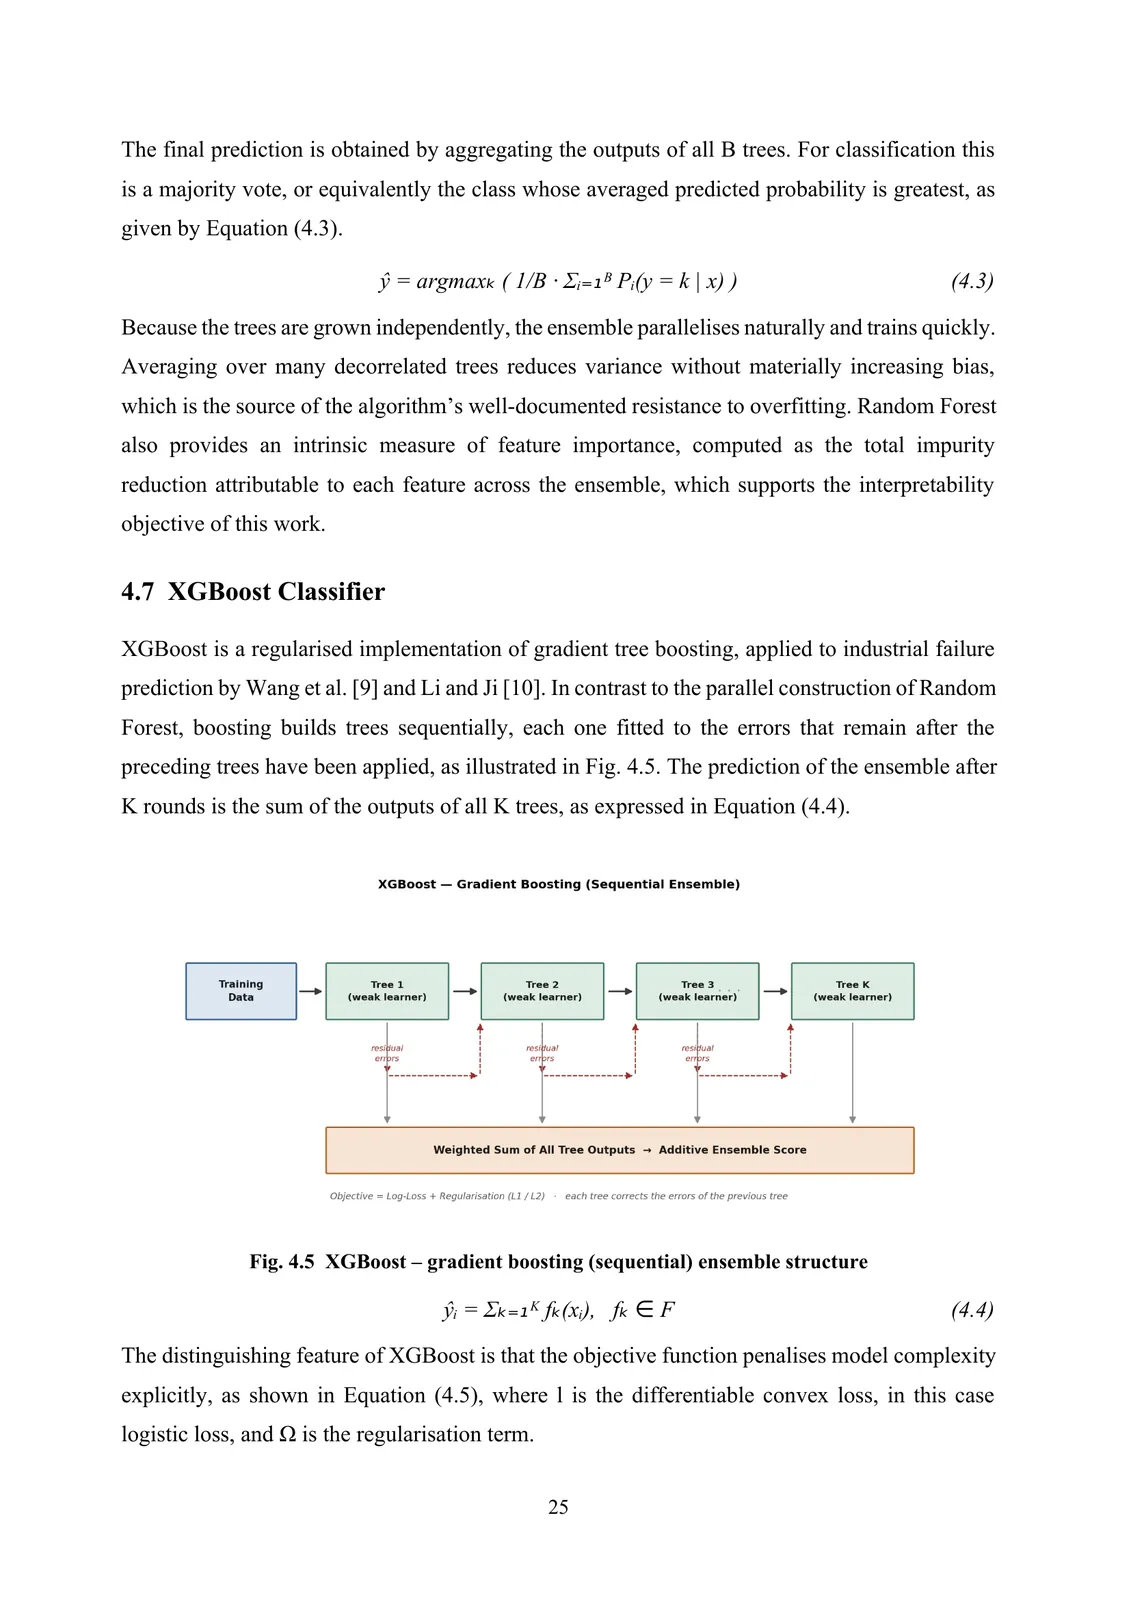
| How trees are built | In parallel, each on a bootstrap sample | One after another, each fitting the remaining errors |
| Mainly reduces | Variance | Bias, with an explicit complexity penalty |
| Imbalance setting | Balanced class weights, plus SMOTE | Positive-class weight, plus SMOTE |
| Tuning effort | Robust to most settings | Needs more careful tuning |
| Explanation | Built-in importance and SHAP | Built-in importance and SHAP |
What was built in Stage-I?
Stage-I is a design stage, so the "build" is the report, the slides and a full set of method figures. The report is written chapter by chapter: introduction, literature review with a research-gap table, problem definition, objectives and scope, methodology, and the Stage-II plan.
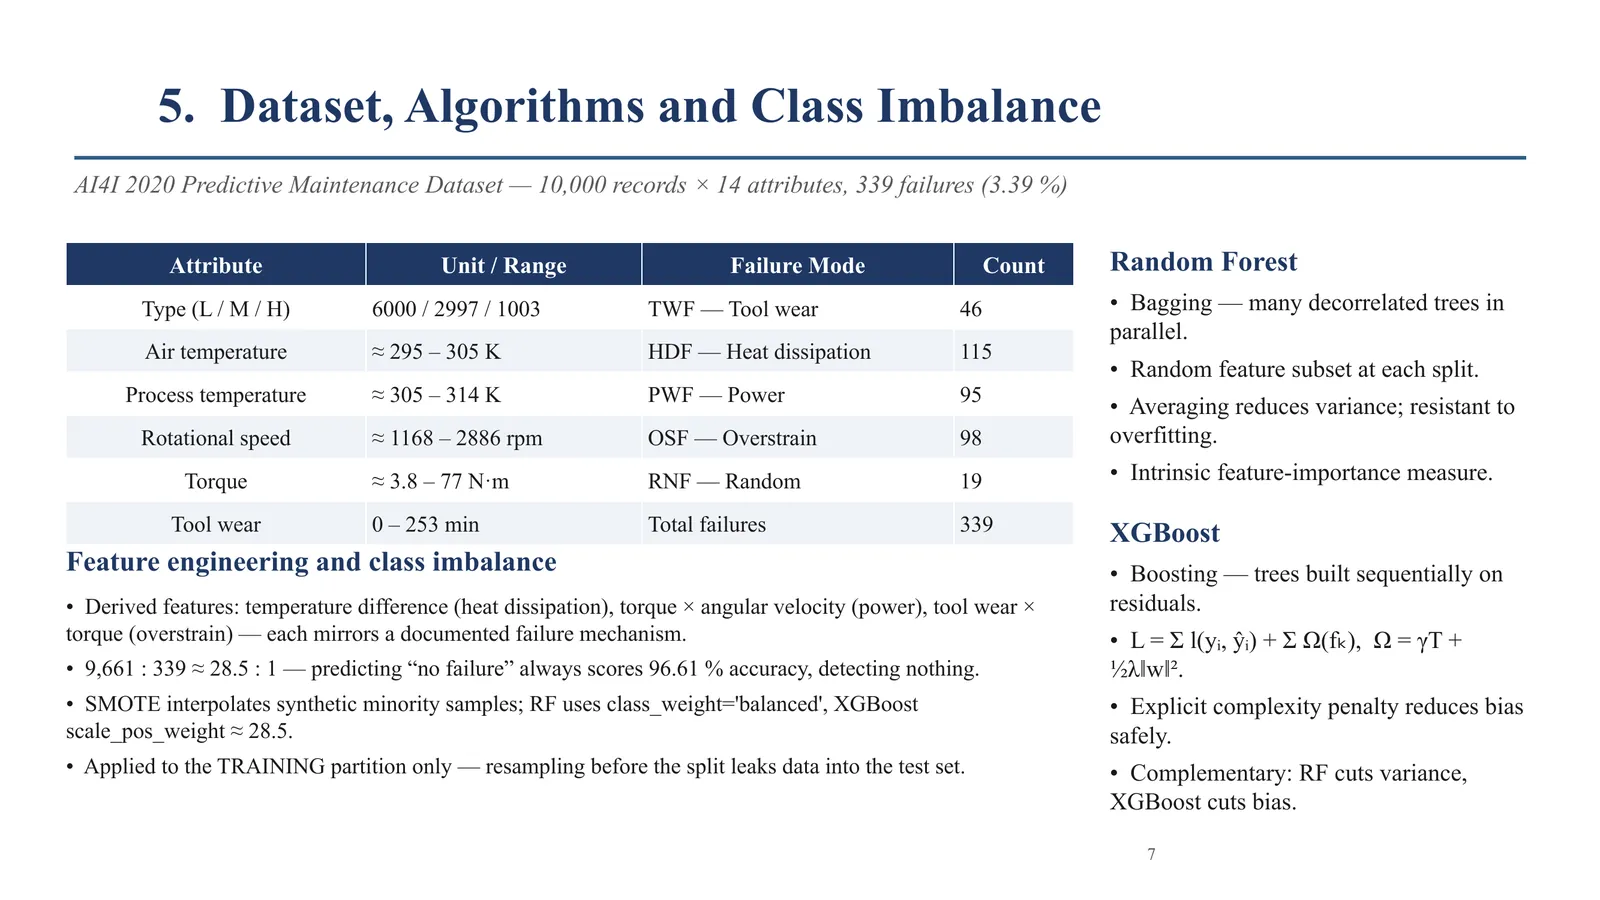
Shown with student, guide, logos and institute details removed.
What results does a Stage-I dissertation report?
None yet, and that is by design. Stage-I fixes how the models will be judged before any are trained, so the Stage-II comparison cannot be tuned to look good afterwards. The evaluation plan in the report sets out:
- An untouched, stratified hold-out set, never used for training, resampling or tuning.
- Accuracy, precision, recall, F1-score, ROC-AUC, PR-AUC and the confusion matrix, with recall and PR-AUC as the main criteria, because a missed failure costs far more than a false alarm.
- Stratified cross-validation to check that differences between the models are stable.
- An ablation of the imbalance strategies (SMOTE, class weights, both, neither).
We only quote numbers that appear in the delivered work. This Stage-I report deliberately reports none; results belong to Stage-II.
The Stage-II plan in the report runs in this order:
Build the pipeline
Exploratory analysis, cleaning and the engineered features.
Train and tune
Both models with SMOTE and class weights, then cross-validated search and the imbalance ablation.
Evaluate and explain
The full metric suite, ROC and precision-recall curves, and SHAP on the selected model.
Deploy and document
A prediction interface for engineers, the Stage-II report and a research paper.
What did the student receive?
- Stage-I dissertation report in the institute's format, as PDF and an editable Word file.
- Seminar presentation (PDF and PPTX): a short deck for the Stage-I review.
- Detailed presentation (PPTX): a longer deck that covers each chapter in more depth.
- Method figures: system architecture, methodology flowchart, pre-processing pipeline, Random Forest and XGBoost diagrams, the SMOTE schematic and the evaluation framework.
- Build scripts that regenerate the figures and rebuild the report and slides, so changes after the guide's review are quick.
No trained model or app was part of Stage-I; those are Stage-II deliverables. If you need a report and slides like these, see our dissertation writing services for M.Tech reports and PPTs.
Our work is building, writing support, guidance and explanation. Use it to learn and to prepare your own submission, and check what your university allows before you submit.
How could you adapt this project for your own topic?
The report's own "outside scope" list is a good source of follow-on topics.
The ideas below are suggestions to discuss with your guide. Our delivered work is in the case studies.
- Topic ideaRemaining useful life on turbofan dataPredict cycles left before failure on NASA C-MAPSS with an LSTM, and compare it with gradient boosting.
- Topic ideaBearing fault diagnosis from vibrationTurn vibration signals into spectrograms and classify fault types with a small CNN.
- Topic ideaFailure-mode classificationPredict which failure is coming (tool wear, heat, power, overstrain), not just whether one is.
- Topic ideaCost-sensitive thresholds vs SMOTESet the alert threshold from the cost of a missed failure and compare it with oversampling.
Frequently asked questions
Can I get a similar predictive maintenance project?
Yes. You can ask for Stage-I only (report, figures and seminar PPT) or for both stages, which adds the implementation, results, final thesis and a paper. The free consultation fixes the scope, timeline and price in writing before any work starts.
Which dataset does this project use?
It uses the public AI4I 2020 Predictive Maintenance Dataset, a synthetic dataset modelled on a milling machine and available from the UCI repository and Kaggle. For remaining-useful-life work, NASA's C-MAPSS turbofan data is common; for vibration-based fault diagnosis, the CWRU bearing dataset is widely used.
What is the difference between Stage-I and Stage-II of an M.Tech dissertation?
Stage-I defines the problem, reviews the literature, identifies research gaps and fixes the methodology and evaluation plan. Stage-II carries out the implementation, reports and compares results, and produces the final thesis and usually a research paper. This project was an M.E. / M.Tech dissertation split the same way. Formats differ between universities, so follow your own guidelines; our guide to M.Tech thesis chapters and Stage-I/II reports shows the usual layout.
Why use SMOTE instead of judging the model by accuracy?
Machine failures are rare, so a model that always predicts no failure scores high accuracy while catching nothing. SMOTE creates synthetic failure samples in the training set only, and the models are judged on recall, F1 and PR-AUC, which show whether failures are actually caught.
What will I need to explain in the viva?
Be ready to explain why accuracy misleads on imbalanced data, why SMOTE is applied after the train-test split, how bagging in Random Forest differs from boosting in XGBoost, why each engineered feature matches a failure mode, why recall and PR-AUC are the main criteria, and what Stage-II will deliver.